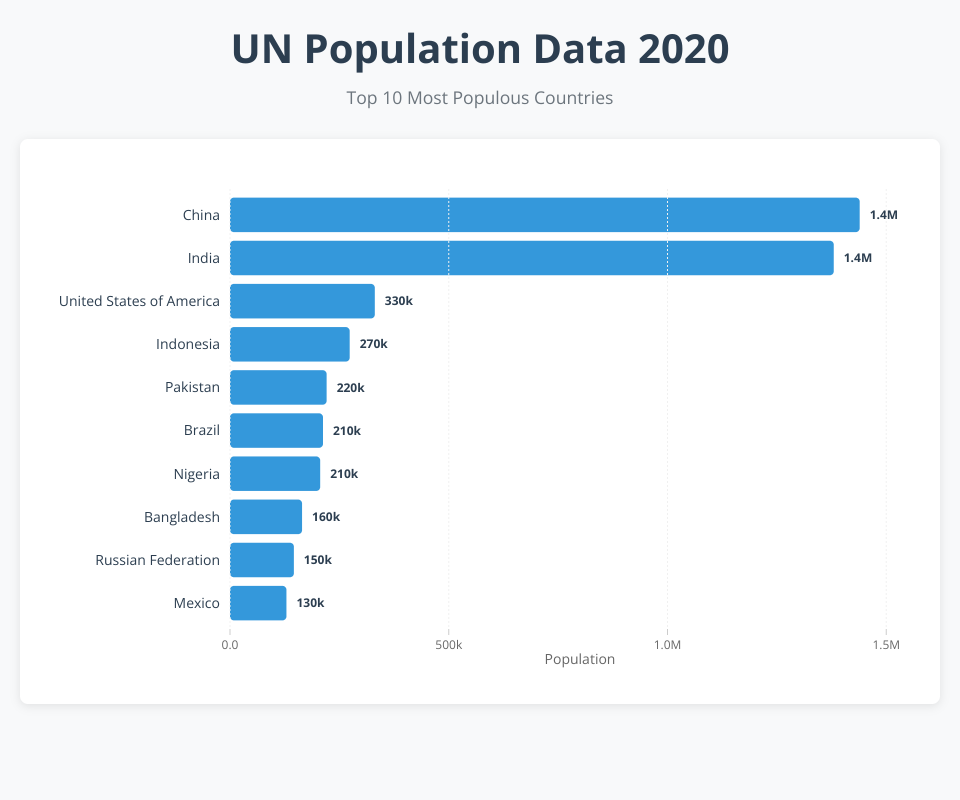
UN Population Bar Chart
An interactive bar chart visualization showing the top 10 most populous countries based on 2020 UN population data.
Features
- Responsive Design: Clean, modern interface that works across devices
- Animated Bars: Smooth transitions when the chart loads
- Formatted Labels: Population numbers displayed with readable formatting (e.g., "1.4B" for billions)
- Grid Lines: Easy-to-read grid lines for better data interpretation
- Error Handling: Proper loading states and error messaging
- Sorted Data: Countries automatically sorted by population in descending order
Technologies Used
- React 16.9
- D3.js 5.11 for data visualization and DOM manipulation
- Modern ES6+ JavaScript
- CSS3 with modern styling
Data Source
Population data is sourced from the UN Population 2019 dataset, using the 2020 population projections.
Running the Project
- Serve the files using a local web server
- Open index.html in a modern web browser
- The chart will automatically load and display the data
Improvements Made
- Added proper margins and padding for better readability
- Implemented smooth animations for visual appeal
- Added comprehensive labels and formatting
- Included grid lines for easier data interpretation
- Improved error handling and loading states
- Enhanced typography and color scheme
- Made the visualization more accessible with proper semantic HTML
- Added data sorting to show the most relevant information first
MIT Licensed