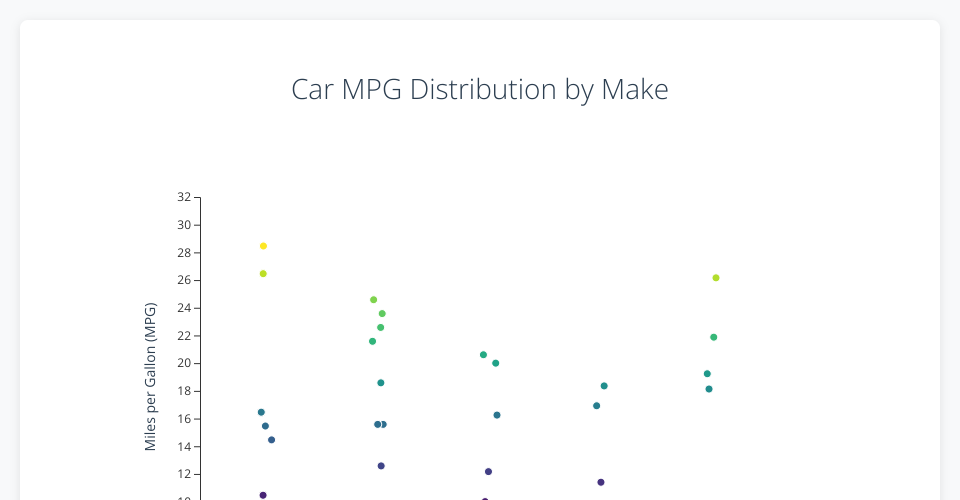
Car MPG Strip Chart
An interactive D3.js visualization showing the distribution of miles per gallon (MPG) across different car manufacturers.
Features
- Interactive Strip Chart: Displays MPG values for different car makes with jittered positioning to avoid overlap
- Color Coding: Points are colored based on MPG values using a viridis color scale
- Tooltips: Hover over data points to see detailed information including make, MPG, and torque
- Jitter Control: Adjust the amount of horizontal jitter using the interactive slider
- Responsive Design: Clean, modern styling with proper axis labels and formatting
Technologies Used
- D3.js v7
- HTML5/CSS3
- Modern JavaScript (ES6+)
File Structure
index.html- Main HTML structurestyles.css- Styling and layoutchart.js- Reusable chart componentmain.js- Application logic and initializationstripechart.csv- Data source
Data Format
The CSV file should contain the following columns:
Make- Car manufacturer nameTorque- Engine torque valuempg- Miles per gallon rating
Usage
- Open
index.htmlin a modern web browser - The chart will automatically load and display the data
- Use the jitter slider to adjust point positioning
- Hover over points to see detailed information
Improvements Made
- Upgraded to D3.js v7
- Modular, reusable chart component
- Proper data joins for smooth animations
- Interactive controls
- Better styling and typography
- Responsive design
- Error handling
- Comprehensive tooltips
- Smooth transitions and animations
MIT Licensed