US State and City Housing Market Map
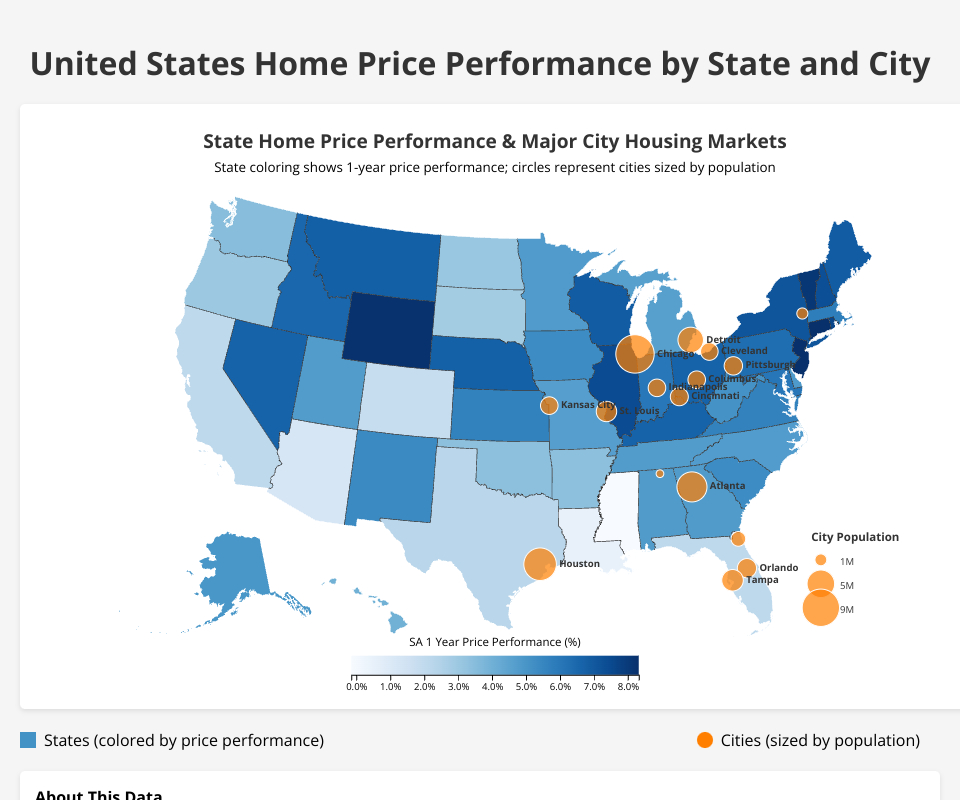
This interactive visualization shows housing market data for US states and cities using D3.js. The map combines state-level home price performance metrics with city-level housing market information.
Features
- Choropleth map of US states colored by 1-year home price performance
- City markers sized by population
- Interactive tooltips showing detailed metrics when hovering over states and cities
- Color and size legends to interpret the values
- Responsive design for various screen sizes
Data
The map uses two datasets:
State Data (data.csv)
- Rank: State ranking based on performance
- SA 1 Period: Seasonally adjusted performance for most recent period
- SA 1 Year: Seasonally adjusted 1-year performance
- SA 5 Year: Seasonally adjusted 5-year performance
- SA Since 1991: Seasonally adjusted performance since 1991
City Data (data1.csv)
- City name and state
- Population
- Median Home Price
- Median Rent
- Household Income
- Job Growth Rate (%)
- Unemployment Rate (%)
Technologies Used
- D3.js for data visualization
- TopoJSON for map data
- HTML/CSS for layout and styling
How to Use
- Open the index.html file in a modern web browser
- Hover over states to see state-level housing performance data
- Hover over city markers to see detailed city housing market information
- Refer to the color scale and size legend to interpret values
MIT Licensed