New York State Real Estate Dashboard
Overview
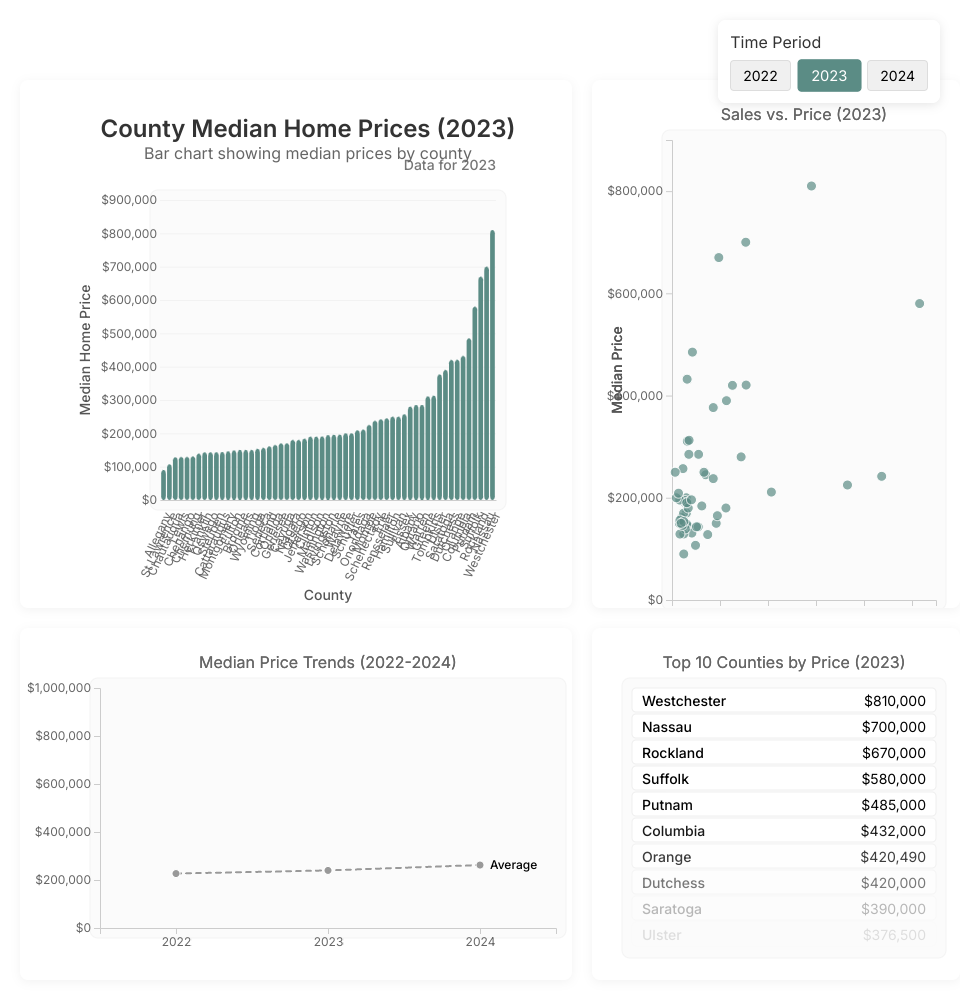
This dashboard visualizes real estate data for counties in New York State from 2022 to 2024. It includes:
- Bar Chart: Shows median home prices by county for the selected year.
- Scatterplot: Displays the relationship between sales volume and median price.
- Trends Chart: Shows the trend of median prices over the three-year period.
- Rankings Panel: Lists the top 10 counties by median price.
Features
- Interactive visualizations that respond to user selections
- Cross-filtering: selecting a county in one chart highlights it in all charts
- Year selection (2022-2024) to view data from different time periods
- Tooltips with detailed information and mini-charts
- Responsive design that adapts to different screen sizes
Technical Details
Built with:
- React for the UI components
- D3.js for data visualization
- CSS Grid for the dashboard layout
Data is loaded from a CSV file containing real estate statistics for New York counties.
Usage
Select a year using the time period buttons in the top right corner. Click on counties in any chart to select them and see them highlighted across all visualizations. Hover over data points to see detailed information.
MIT Licensed