Crimes Against Children in India Dashboard
This interactive dashboard visualizes data on crimes against children in India from 2020 to 2022. The data is presented through various chart types to provide comprehensive insights.
Visualizations Included:
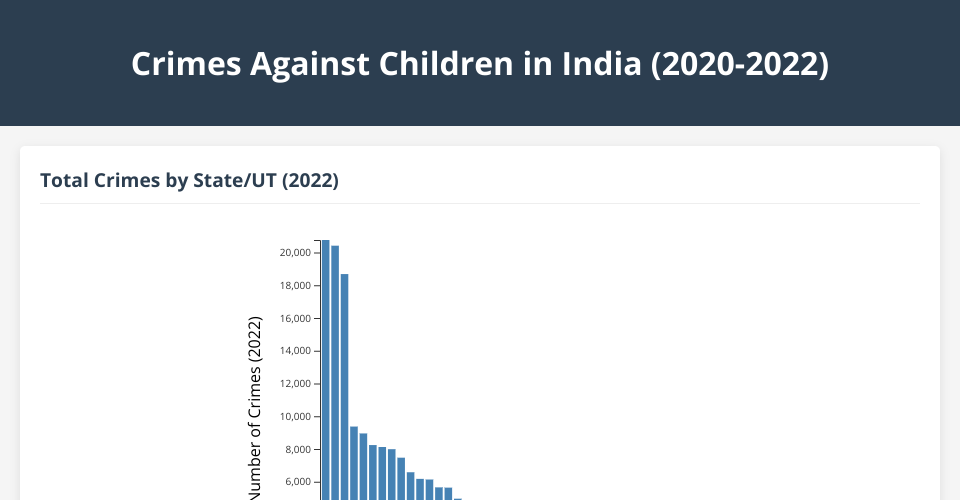
- Bar Chart: Shows total crimes by state/UT in 2022
- Scatter Plot: Compares crime rate vs chargesheeting rate
- Line Chart: Displays trends of crimes against children for top 10 states
- Histogram: Shows the distribution of crime rates across states
- Horizontal Bar Chart: Highlights top 10 states by number of crimes
- Area Chart: Visualizes the all-India trend over three years
- Pie Chart: Shows the proportion of crimes by region type
- Year Comparison Scatter: Compares 2020 vs 2022 crime numbers
- Heatmap: Displays crimes by state and year for top 15 states
How to View
Open index.html in a modern web browser to view the dashboard.
Data Source
The data used in this dashboard represents total crimes against children in India from 2020 to 2022, including breakdowns by state/UT, crime rates per lakh children, and chargesheeting rates.
MIT Licensed