Napoleon's Russian Campaign Visualization
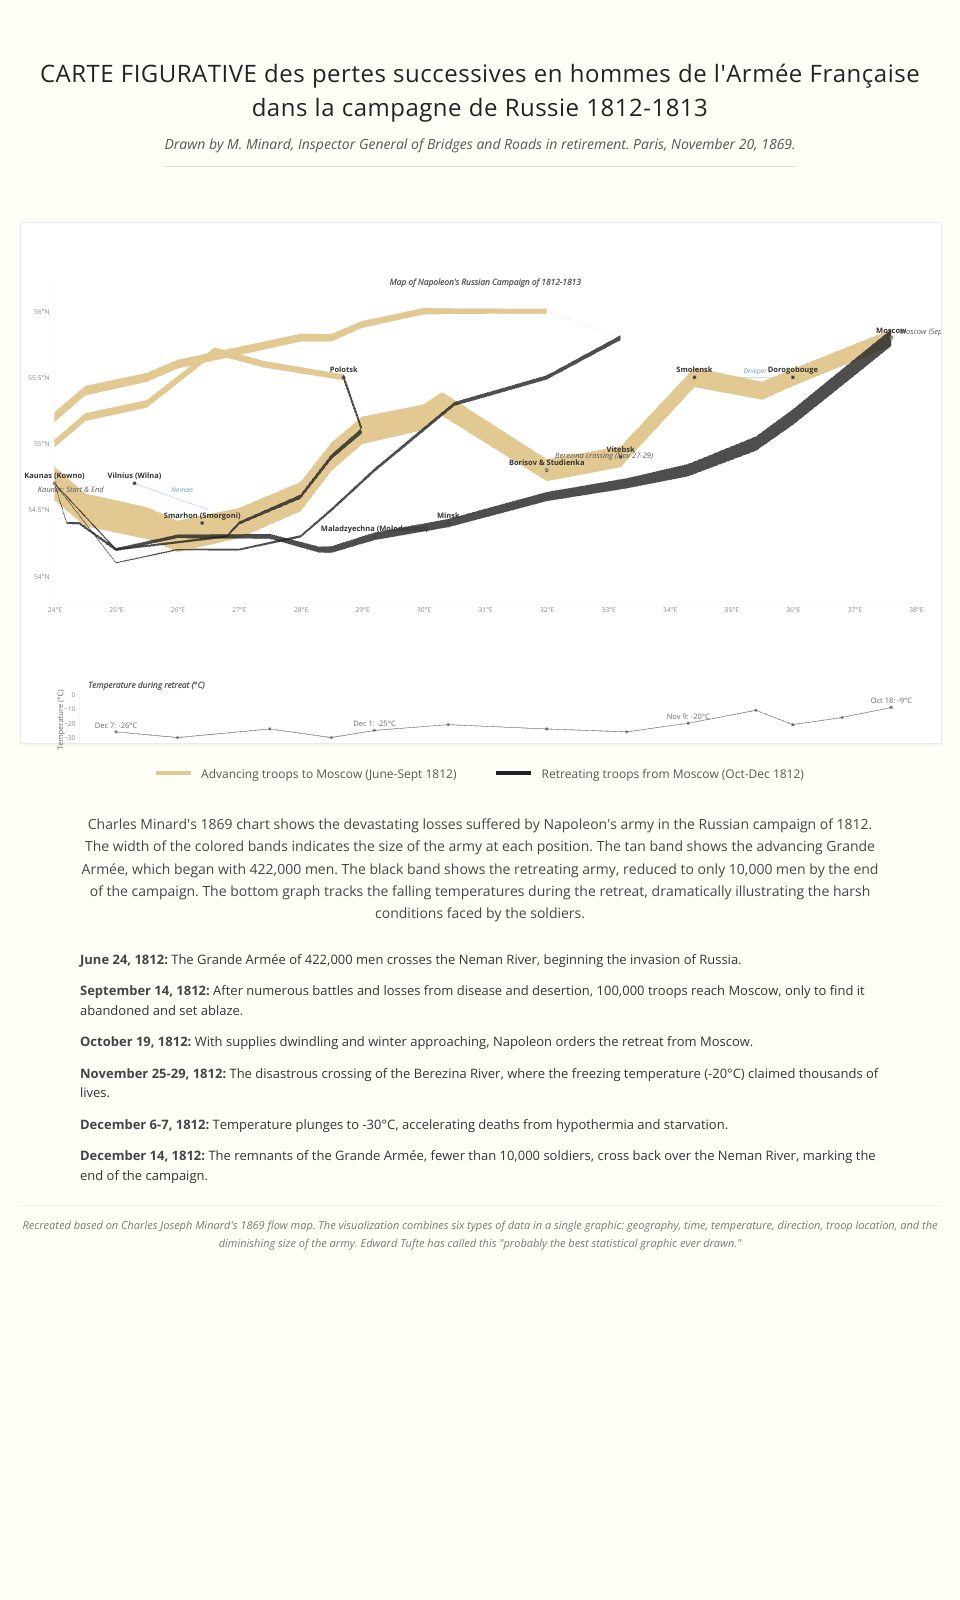
This project recreates Charles Minard's famous 1869 visualization of Napoleon's disastrous Russian campaign of 1812. The visualization shows the devastating losses suffered by the French army during b
Visualization Features
- Troop Movement: The width of the path is proportional to the number of troops
- Advance path: Colored in tan (#D2B48C) showing the army's march to Moscow
- Retreat path: Colored in dark gray (#333333) showing the devastating retreat
- Geographic Context: Cities and rivers are marked on the map
- Temperature Chart: Shows the dropping temperatures during the winter retreat
- Interactive Elements: Hover over cities and troop paths for additional information
Historical Context
This visualization depicts one of history's most famous military disasters:
- June 1812: Napoleon's Grande Armée of 422,000 soldiers crosses into Russia
- September 1812: Only 100,000 troops reach Moscow
- October-December 1812: The retreat through the Russian winter decimates the army
- December 1812: Merely 10,000 soldiers survive to cross back over the Niemen River
Implementation Details
This visualization is built with modern web technologies:
- D3.js: For data visualization and geographical mapping
- Responsive Design: Scales appropriately for different screen sizes
- Tufte-inspired Styling: Minimalist aesthetic with high data-to-ink ratio
The implementation follows Edward Tufte's visualization principles, focusing on clear data representation with minimal chartjunk while honoring Minard's original concept.
Data Sources
The visualization combines several data elements:
- Troop movements with size information
- Geographical locations of cities and rivers
- Temperature data during the retreat
- Key dates and events of the campaign
Based on Charles Joseph Minard's original 1869 flow map, which is considered one of the finest statistical graphics ever created.
MIT Licensed