Sankey Diagram Visualization
This project demonstrates an interactive Sankey diagram built with React and D3.js. Sankey diagrams are useful for visualizing flow distributions between different stages or categories.
Features
- Interactive visualization with hover effects
- Responsive design
- Color-coded flows
- Clean, modern styling with gradient backgrounds
- Tooltips with detailed information
- Rounded corners and visual enhancements
- Glowing effect on hover for links
Data Structure
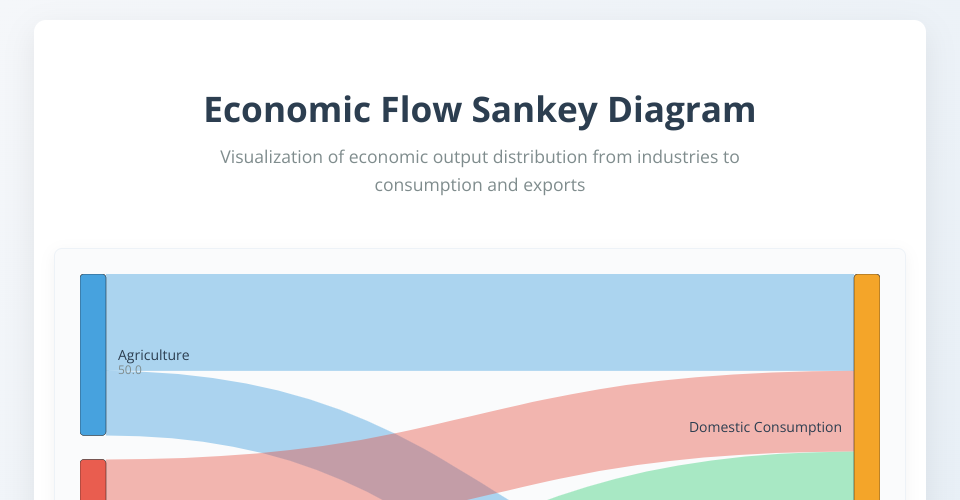
The diagram visualizes flows from source categories (Agriculture, Manufacturing, Services) to destination categories (Domestic Consumption, Exports).
Libraries Used
- React for UI components
- D3.js for data visualization
- D3-Sankey for Sankey diagram layout calculations
MIT Licensed