Israel-Hamas Conflict Timeline
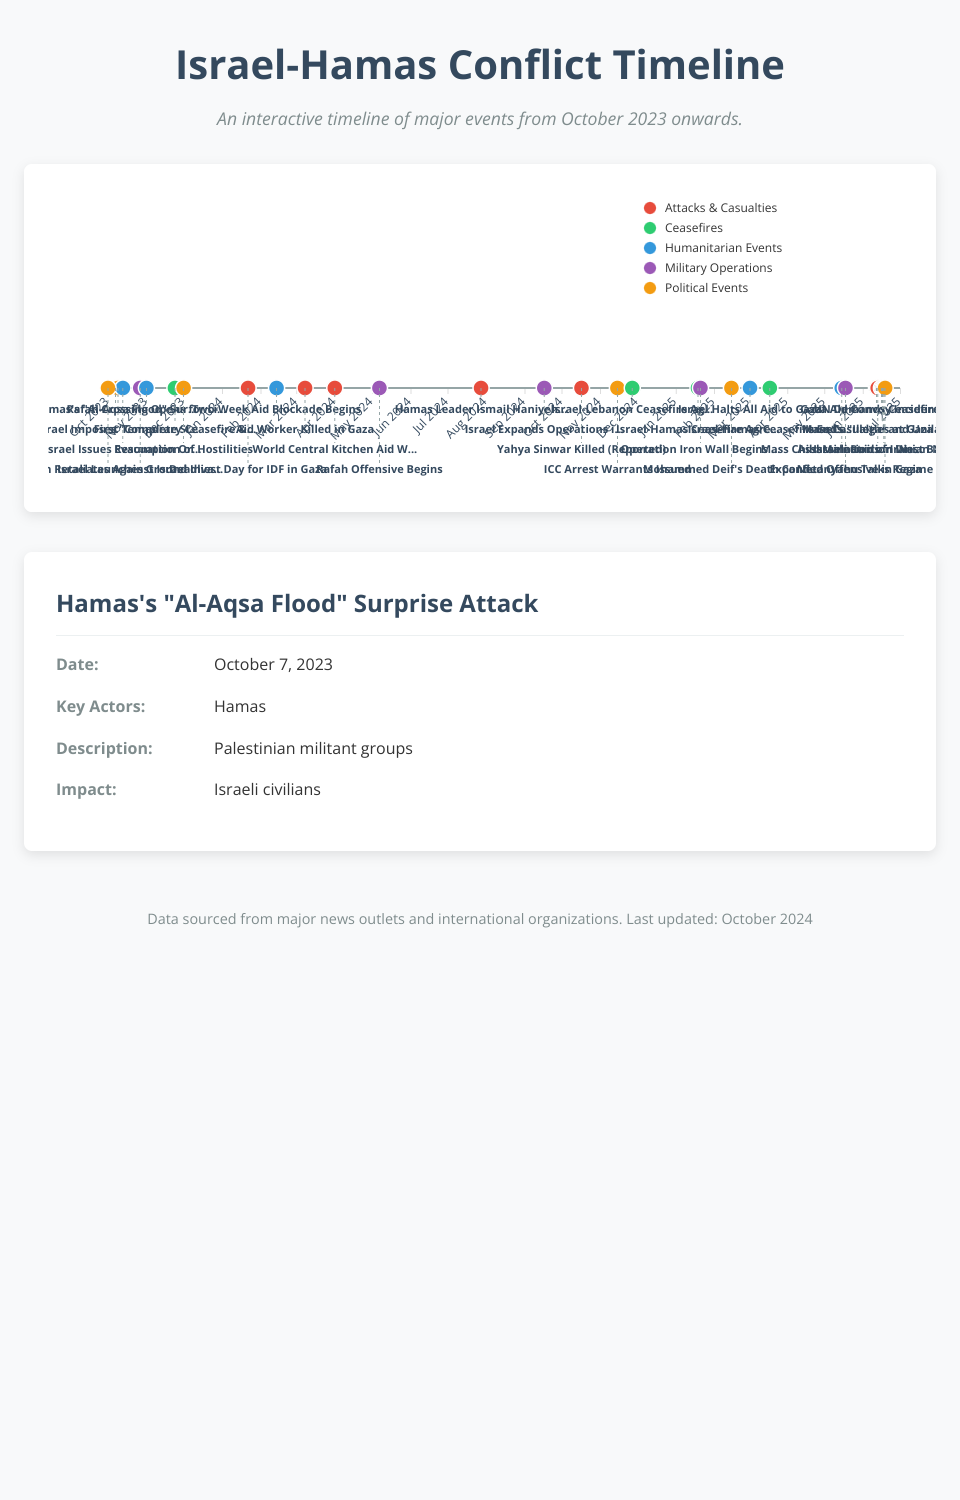
An interactive timeline visualization showing major events in the Israel-Hamas conflict from October 2023 onwards.
Features
- Interactive timeline with event markers
- Color-coded events by category (attacks, ceasefires, humanitarian events, etc.)
- Detailed information panel for each event
- Responsive design for desktop and mobile viewing
Implementation
The visualization uses D3.js for rendering the timeline and event data. Events are loaded from a CSV file and processed to ensure proper date formatting and categorization.
File Structure
index.html- Main HTML filestyles.css- Stylesheetindex.js- Main JavaScript entry pointdataProcessor.js- Functions for processing and categorizing the event datatimelineChart.js- D3.js code for rendering the timeline visualizationdata.csv- Event data in CSV format
Usage
Simply open the index.html file in a modern web browser. Click on any event marker in the timeline to view detailed information about that event.
MIT Licensed