City Data Visualization
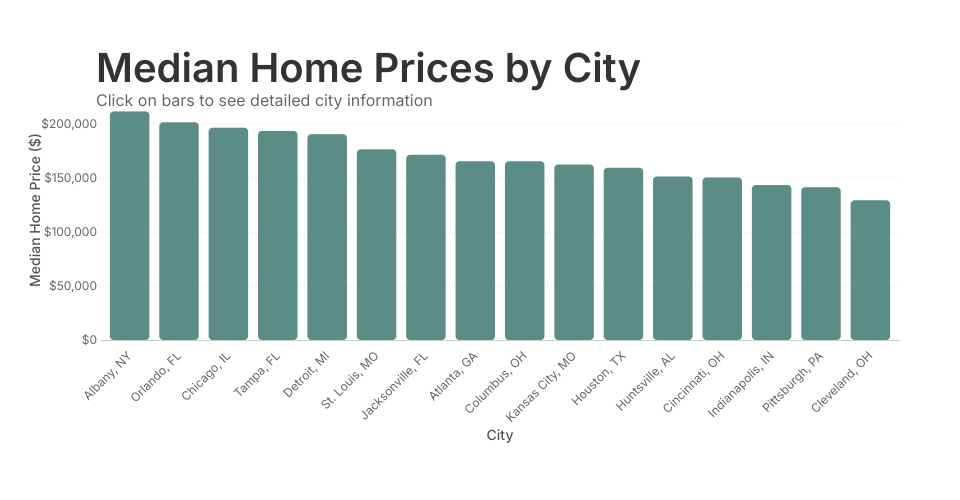
This visualization shows median home prices across different US cities. The data includes information about population, median home prices, median rent, household income, job growth rate, and unemployment rate.
Features
- Interactive bar chart showing median home prices sorted by value
- Click on bars to display detailed city information
- Responsive design that adapts to viewport size
- Clean, modern visual style with consistent typography
- Smooth transitions for interactive elements
Implementation
Built with React and D3.js, this visualization demonstrates:
- Data-driven DOM updates using D3's enter-update-exit pattern
- Scales and axes for proper data representation
- Interactive elements with state management
- Responsive layout that adjusts to different screen sizes
- Asynchronous data loading with loading indicators
MIT Licensed