India Crime Rate Map Visualization
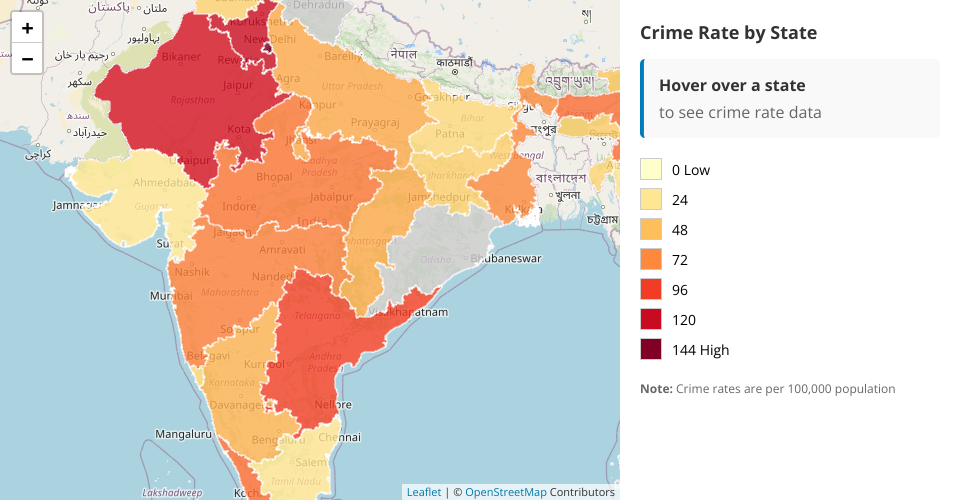
This project creates an interactive map visualization showing crime rates across Indian states and union territories.
Features
- Interactive choropleth map of India
- Color-coded states based on crime rates
- Hover effects with detailed information
- Legend showing crime rate ranges
- Responsive design with information panel
Data
The visualization uses data from data.csv which contains:
- State/Union Territory names
- Crime rates per 100,000 population
How to Use
- Open
index.htmlin a web browser - Hover over states to see detailed crime rate information
- The legend on the right shows the color scale and selected state details
- Zoom and pan the map to explore different regions
Technical Details
- Built with D3.js for data visualization
- Uses Leaflet.js for map interaction
- Responsive design with CSS Grid/Flexbox
- Color scale uses D3's sequential color scheme
- State boundaries from GeoJSON data
Files
index.html- Main visualization filedata.csv- Crime rate data by stateREADME.md- This documentation
MIT Licensed