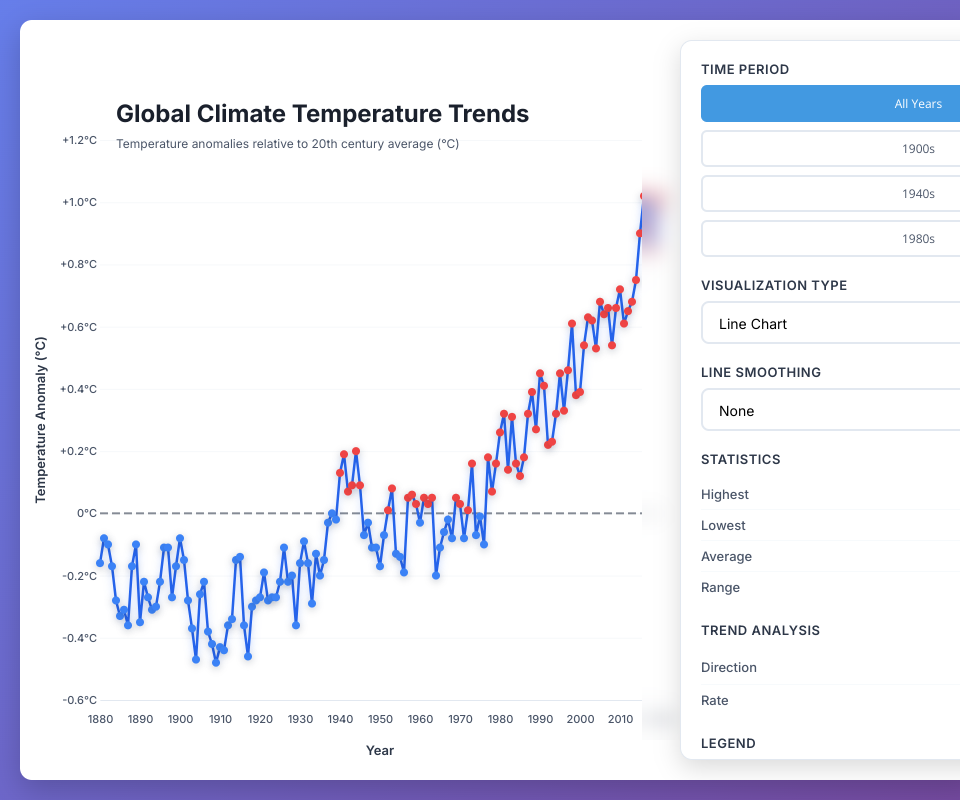
Global Climate Temperature Trends Visualization
An interactive D3.js visualization showing global temperature anomalies from 1880-1928, built with React and modern JavaScript.
Features
- Interactive line and area chart views
- Customizable line smoothing options
- Hover tooltips with detailed information
- Real-time statistics and trend analysis
- Responsive design
- Clean, modern interface
Controls
- Visualization Type: Toggle between line chart and area chart
- Line Smoothing: Choose from linear, monotone, or smooth curves
- Interactive Elements: Hover over data points for details
Data
Temperature anomalies are shown relative to the 20th century average, with:
- Red indicating above-average temperatures
- Blue indicating below-average temperatures
Usage
Open index.html in a modern web browser. No build step required.
MIT Licensed