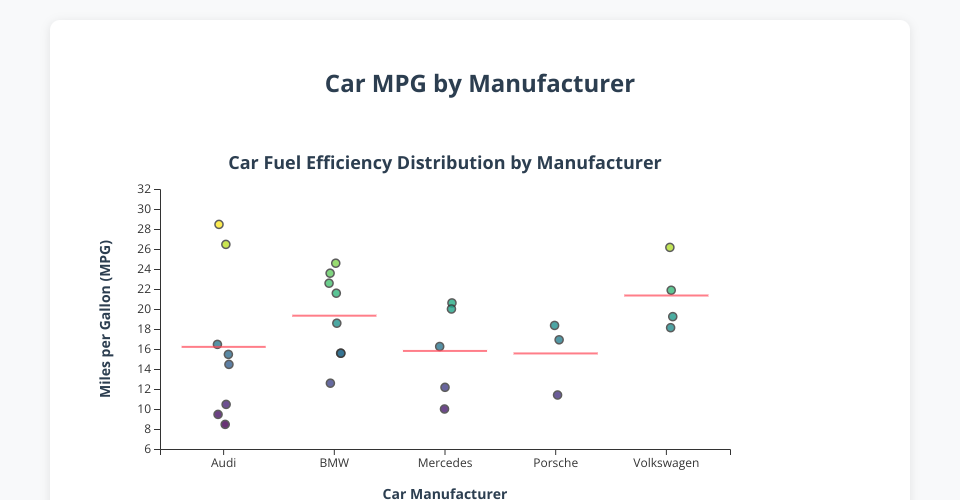
Car MPG Strip Chart
An interactive D3.js visualization showing the distribution of fuel efficiency (Miles Per Gallon) across different car manufacturers.
Features
- Interactive strip chart displaying MPG values for different car brands
- Jitter control to adjust point spread for better visibility
- Color-coded points based on MPG values
- Hover tooltips showing detailed information
- Mean lines for each manufacturer
- Responsive design that works on different screen sizes
- Smooth animations and transitions
Files
index.html- Main HTML structurestyles.css- CSS styling and responsive designchart.js- D3.js chart creation and update functionsmain.js- Data loading and interaction handlingstripechart.csv- Sample car data
Data Format
The CSV file should contain:
Make- Car manufacturer namempg- Miles per gallon (numeric)Torque- Engine torque (numeric, optional for display)
Usage
- Open
index.htmlin a web browser - Use the jitter slider to adjust point spreading
- Hover over points to see detailed information
- Red lines show the mean MPG for each manufacturer
Browser Compatibility
- Modern browsers with ES6 support
- Uses D3.js v7 for enhanced performance and features
Improvements Made
- Upgraded to D3.js v7 for better performance
- Added responsive design and modern CSS
- Implemented proper data joins for idempotent updates
- Added interactive jitter control
- Enhanced tooltips with more information
- Added mean lines for statistical insight
- Improved color scheme and styling
- Added error handling for missing data
- Modular code structure with separate files
- Better accessibility and semantic HTML
MIT Licensed