Community Solar Providers Visualization
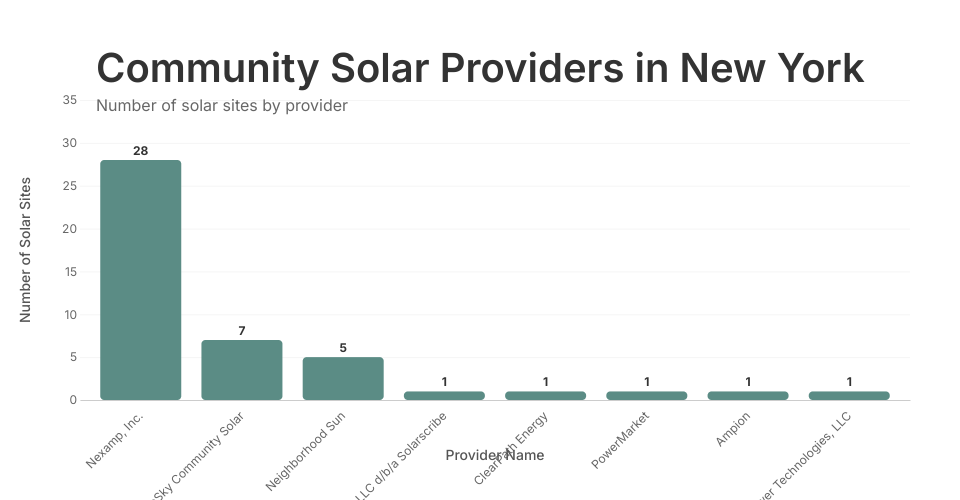
This visualization shows the number of solar sites operated by different community solar providers in New York state. The data is sourced from a CSV file containing information about solar providers, their locations, and utility companies.
Features:
- Bar chart showing the number of solar sites by provider
- Interactive - click on a bar to see details about a specific provider
- Shows provider website and sample locations when a provider is selected
- Responsive design that adapts to window size
Technologies:
- React for application framework
- D3.js for data visualization
- CSS for styling
MIT Licensed