AI Platforms Data Visualization Dashboard
An interactive visualization dashboard for comparing AI platforms' usage data across different time periods.
Features
Multiple visualization types:
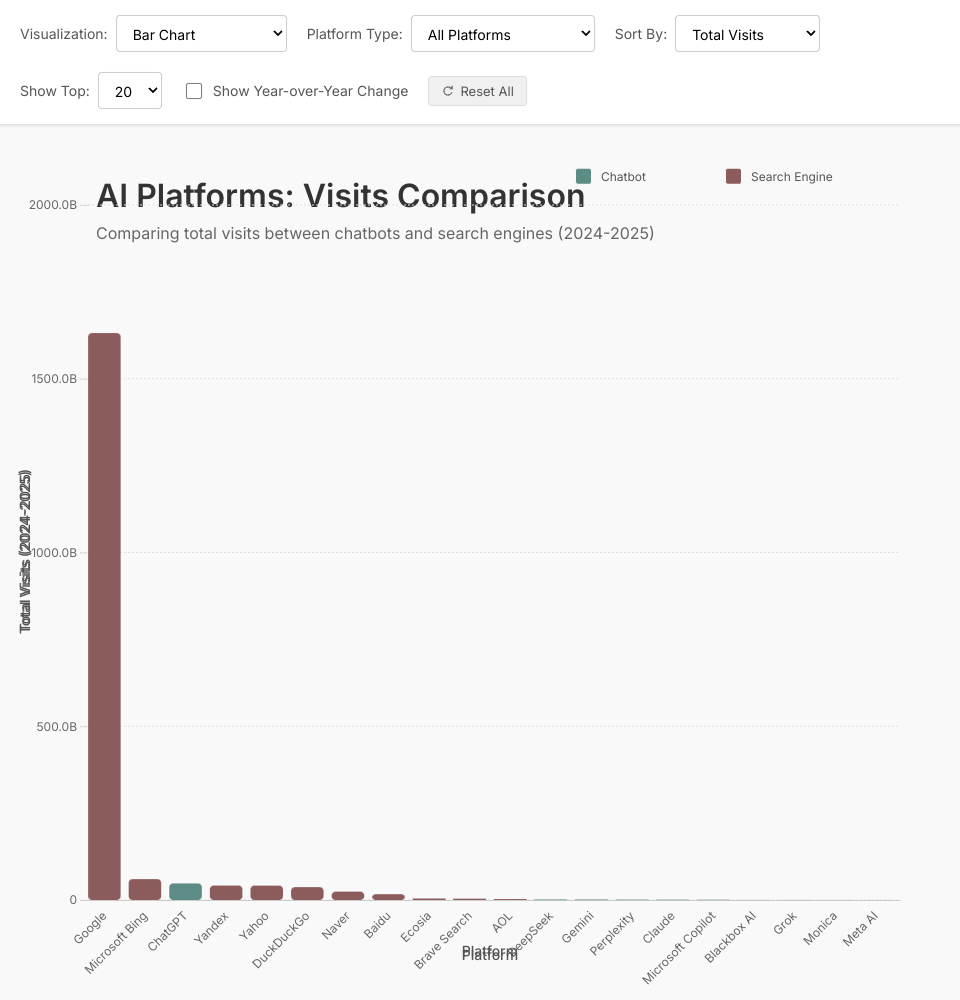
- Bar Chart: Compare total visits across platforms
- Grouped Bar Chart: Side-by-side comparison of previous vs current year
- Line Chart: Analyze growth trends between time periods
- Pie Chart: Visualize market share by platform type
- Scatter Plot: Compare growth rate vs. total visits
- Treemap: Hierarchical view of platform visits
Interactive controls:
- Filter by platform type (Chatbot or Search Engine)
- Sort by total visits, YoY change, or name
- Limit the number of displayed platforms
- Toggle Year-over-Year change indicators
- Click on platforms to focus on specific data points
Data
The visualization uses visit data for AI platforms (both chatbots and search engines) between April 2023-March 2024 and April 2024-March 2025.
Implementation
Built using React and D3.js to create responsive, interactive data visualizations.
MIT Licensed