New York Community Solar Dashboard
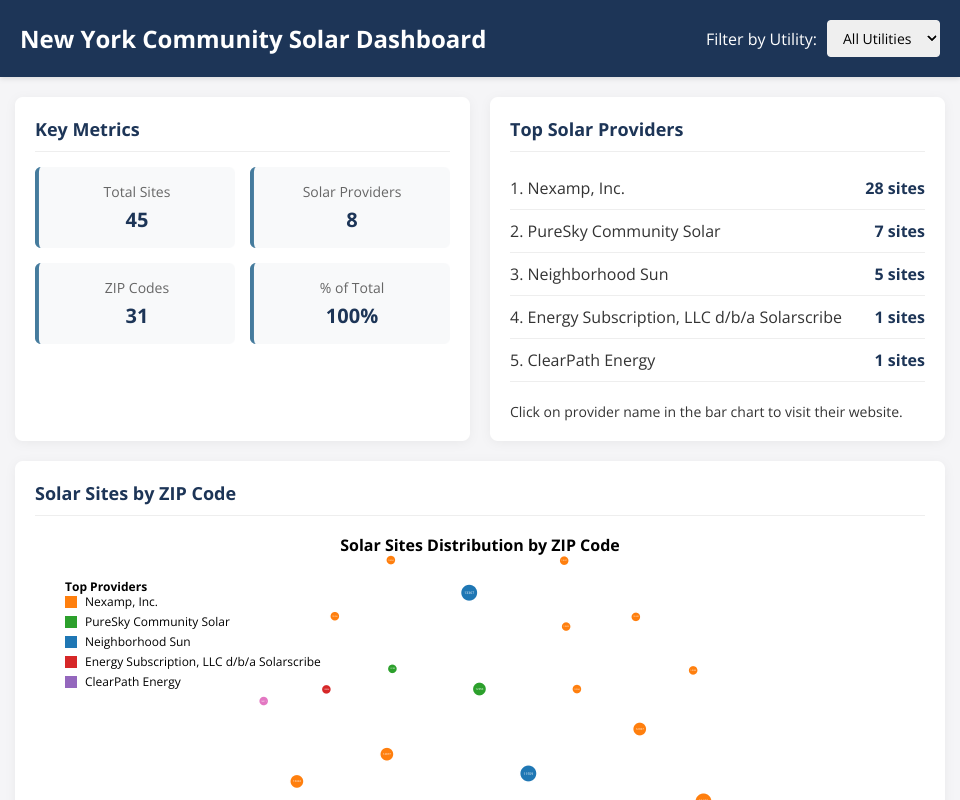
This dashboard visualizes community solar project data across New York state, showing the distribution of solar sites by utility company, provider, and ZIP code.
Features
- Interactive visualizations of solar site distribution
- Filtering by utility company and ZIP code
- Detailed metrics on solar providers and their presence
- Bubble visualization showing relative solar site density by ZIP code
- Bar charts displaying top providers and ZIP codes
Data
The dashboard uses data from a CSV file containing information about:
- Electric utility companies
- ZIP codes with solar installations
- Solar providers and their websites
- Site addresses
Usage
- Open
index.htmlin a modern web browser - Use the utility filter to view data for specific utility companies
- Click on ZIP code bubbles or bars to see detailed information about that location
- Click on provider bars to visit their websites
Technologies Used
- D3.js for data visualization
- JavaScript for interactivity
- HTML/CSS for layout and styling
MIT Licensed