New York State County Data Visualization
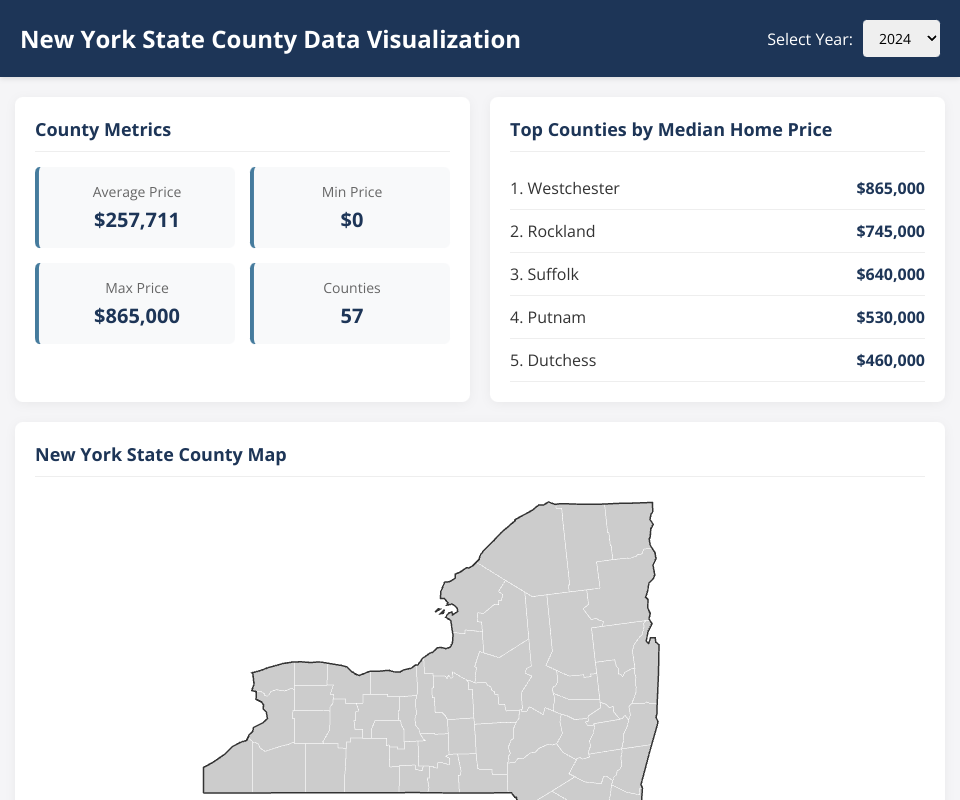
This dashboard visualizes county-level median home price data for New York State using data from data.csv.
Features
- Interactive Map: Color-coded map showing median home prices with hover tooltips
- Year Selector: Switch between 2022, 2023, and 2024 to see historical data
- County Filtering: Click on any county to filter all visualizations
- Metrics Dashboard: Shows average, min, and max median home prices for the selected year
- Top Counties: Lists counties with the highest median home prices
- Bar Chart: Compares median home prices across counties
- Trend Chart: Shows median home price trends over time for selected counties
Data Source
- County data:
data.csv(2022-2024 median home prices)
Usage
- Use the year selector to change the displayed year
- Click on any county in the map to filter all visualizations
- Use the "Reset Filter" button to clear the county filter
- Hover over map elements and charts to see detailed tooltips
MIT Licensed
Comments
Suggestion for improvement: use
pointer-events: noneCSS on the labels, so they don't interfere with the tooltips.