U.S. Trade Policy Map 2025
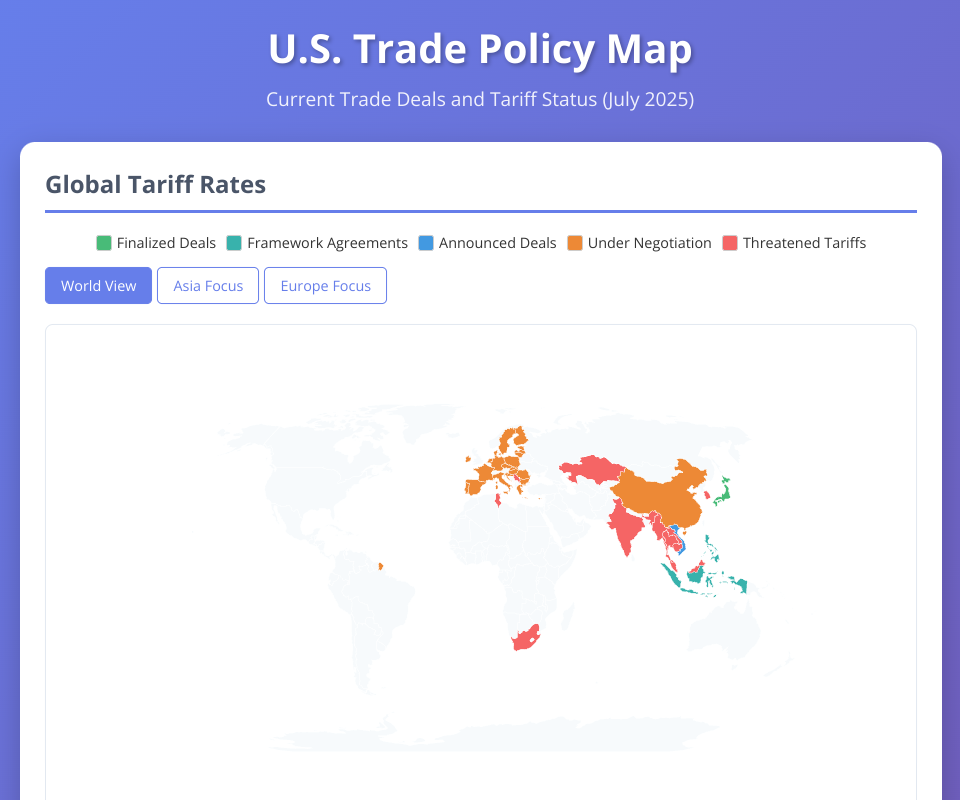
An interactive world map visualization showing current U.S. trade deals, tariff rates, and negotiation status with various countries.
Features
- Interactive world map with country-specific trade data
- Color-coded countries based on deal status (finalized, negotiating, threatened, etc.)
- Multiple view modes: World, Asia Focus, Europe Focus
- Hover tooltips with detailed trade information
- Click countries for expanded details
- Responsive design for mobile and desktop
Trade Data Visualization
The map displays tariff rates and deal status for:
- Finalized Deals: Japan ($550B investment deal)
- Framework Agreements: Philippines, Indonesia
- Announced Deals: Vietnam
- Active Negotiations: EU, China
- Threatened Tariffs: Multiple countries facing 25-40% tariffs
Technology Stack
- D3.js for interactive map visualization
- TopoJSON for efficient geographic data
- CSS Grid for responsive layout
- Natural Earth projection for world view
- Mercator projection for regional focus views
Controls
- World View: Complete global overview
- Asia Focus: Zoomed view of Asian trade partners
- Europe Focus: Detailed view of European negotiations
- Interactive Elements: Hover for tooltips, click for details
- Zoom & Pan: Mouse wheel and drag to navigate
The visualization provides real-time insight into the complex landscape of U.S. international trade relationships and pending negotiations.
MIT Licensed