Awesome SVG Data Visualization
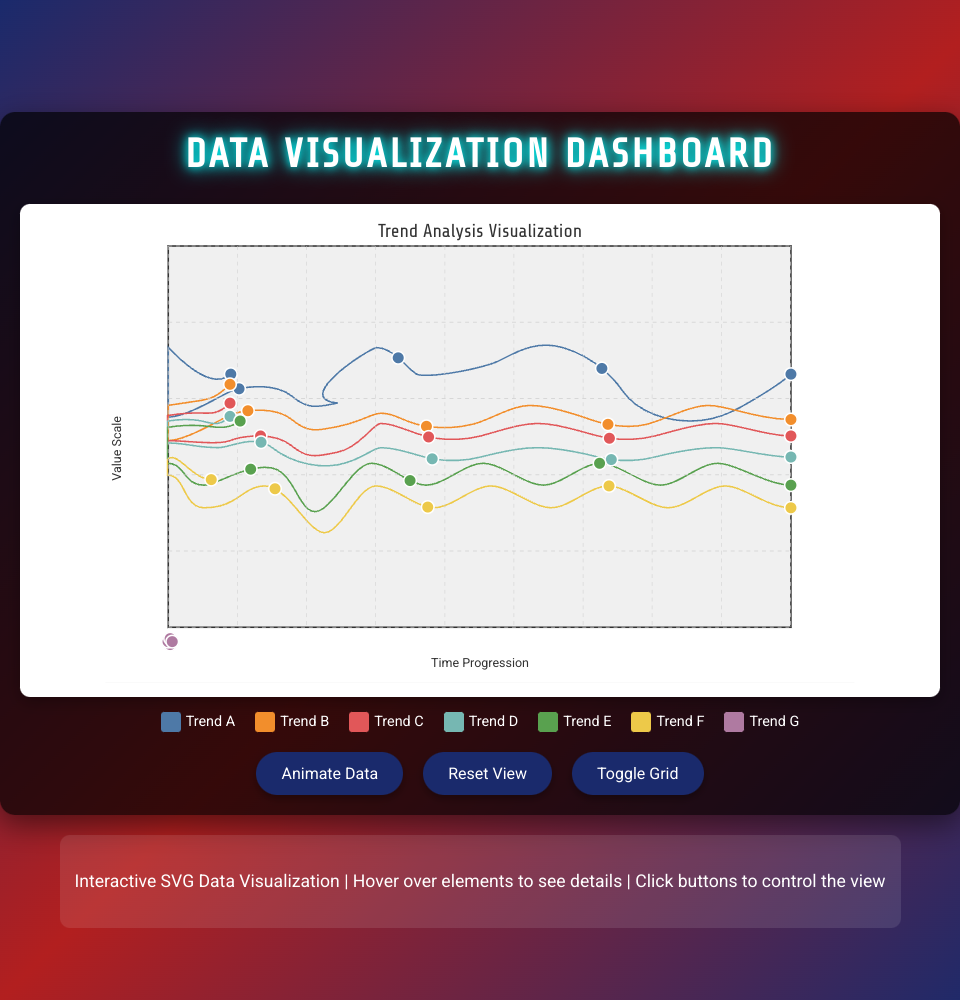
This project transforms a basic SVG into an interactive, animated data visualization dashboard using D3.js.
Features
- Interactive Paths: Hover over trend lines to see details and highlighting effects
- Animated Data Points: Circles placed along paths with smooth entrance animations
- Dynamic Controls: Buttons to animate, reset, and toggle grid visibility
- Modern UI Design: Gradient background, glass-morphism container, and glowing effects
- Responsive Layout: Adapts to different screen sizes
- Visual Legend: Color-coded legend for easy trend identification
- Tooltip System: Detailed information on hover
How to Use
- Open
index.htmlin a web browser - Hover over any colored path to see trend details
- Click "Animate Data" to see a pulsing animation effect
- Click "Reset View" to return to the original state
- Click "Toggle Grid" to show/hide the background grid
Technologies
- HTML5
- CSS3 (with modern effects like gradients and shadows)
- SVG (Scalable Vector Graphics)
- D3.js v7 (Data-Driven Documents)
Customization
You can easily modify the data, colors, and animations by editing the script.js file. The visualization uses D3's data joins for optimal performance and is designed to be extensible.
License
MIT
MIT Licensed