Chinese Companies Dashboard
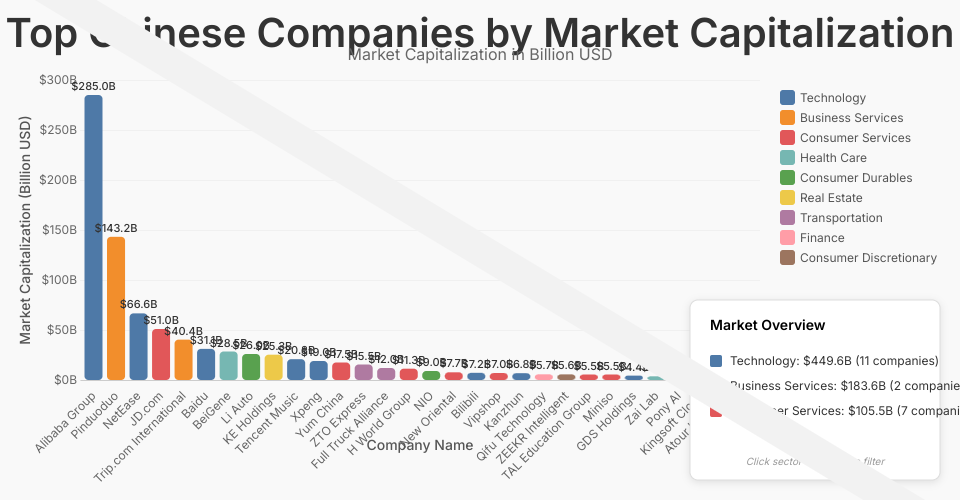
This dashboard visualizes the top Chinese companies by market capitalization, offering an interactive way to explore market data.
Features
- Bar chart showing market capitalization of top Chinese companies
- Color-coded sectors for easy identification
- Interactive tooltips with detailed company information
- Ability to filter by sector
- Summary panel with market overview
- Responsive design that adapts to different screen sizes
Usage
- Hover over bars to see detailed company information
- Click on a bar to highlight a specific company
- Click on a sector in the legend to filter companies by sector
- View summary statistics in the bottom-right panel
Data
The visualization uses data from data.csv which includes:
- Company name
- Market capitalization (in billions USD)
- Sector
- IPO year
- IPO value
- Growth since IPO
Implementation Details
Built with React and D3.js, following a component-based architecture with clean separation of concerns.
MIT Licensed