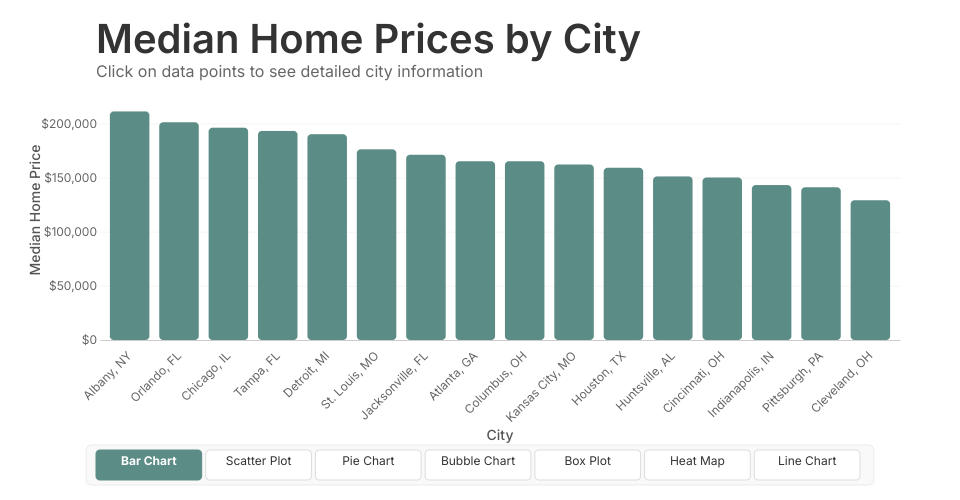
City Housing Dashboard
Interactive dashboard for analyzing city housing data using React and D3.js.
Features
- Multiple chart types (bar, scatter, pie, bubble, boxplot, heatmap, line)
- Interactive selection of cities for detailed information
- Responsive design that adapts to different screen sizes
- Color and size encodings for multi-dimensional analysis
Usage
- Load the application in a web browser
- Select different chart types using the navigation bar at the bottom
- Click on cities to view detailed information
- Analyze trends, comparisons, and relationships in the data
Technology Stack
- React.js for UI components
- D3.js for data visualization
- CSS for styling
MIT Licensed