Trade Balance Visualization (Playfair Style)
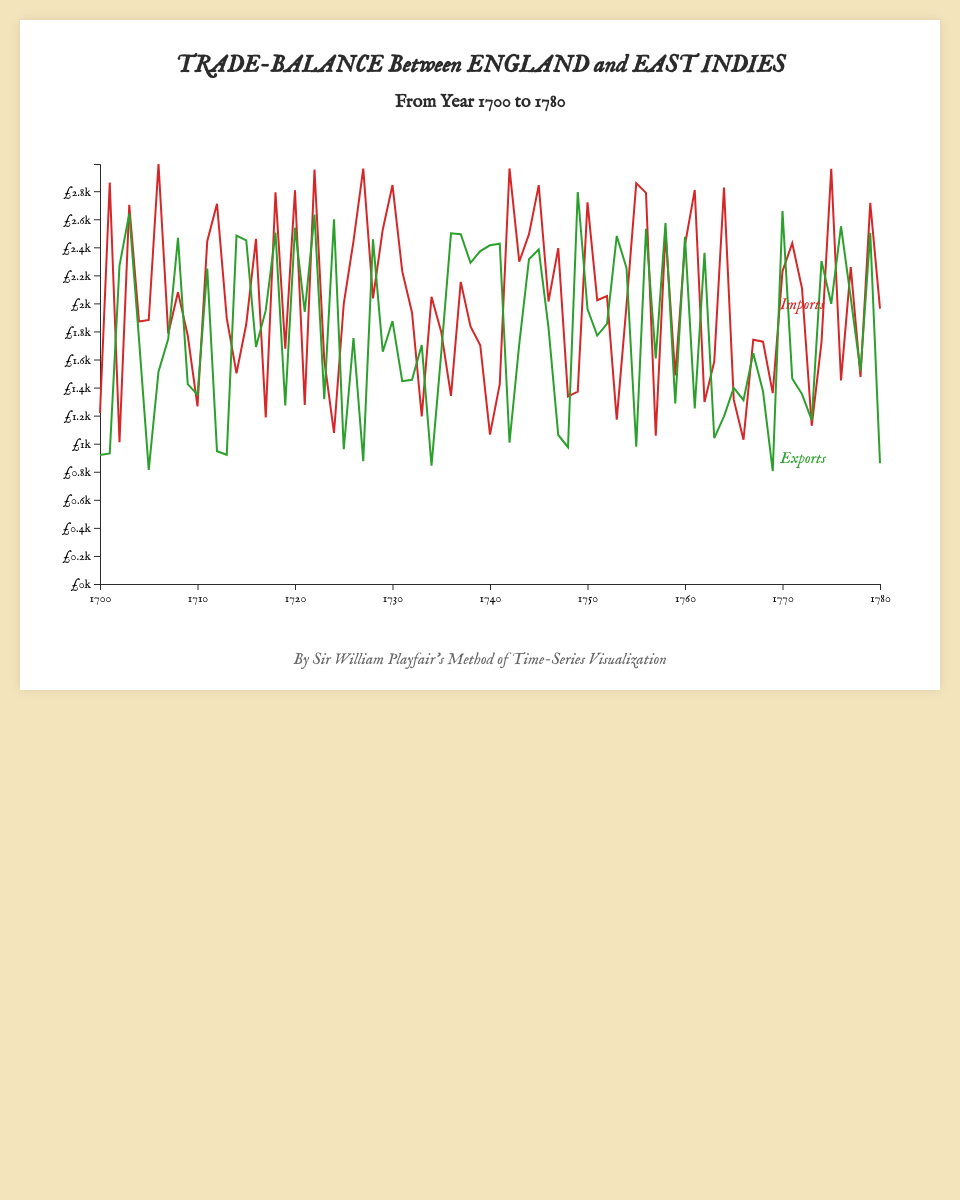
This visualization recreates William Playfair's famous time-series charts from the 18th century, showing:
- Trade balance between England and East Indies (1700-1780)
- Import and export values in thousands of pounds
- Dual-line chart with period styling
Features:
- Historical typography using IM Fell English font
- Authentic color scheme
- Period-appropriate labeling
- Clean, minimal design following Playfair's principles
- Responsive SVG visualization
- D3.js implementation
The visualization demonstrates Playfair's innovative approach to data visualization, using:
- Time series on the x-axis
- Monetary values on the y-axis
- Dual-line comparison
- Direct labeling of data series
MIT Licensed