Resources
Contact
Pricing
🇺🇸
EN
Log in
Open Editor
Revision History
Export Image
Share
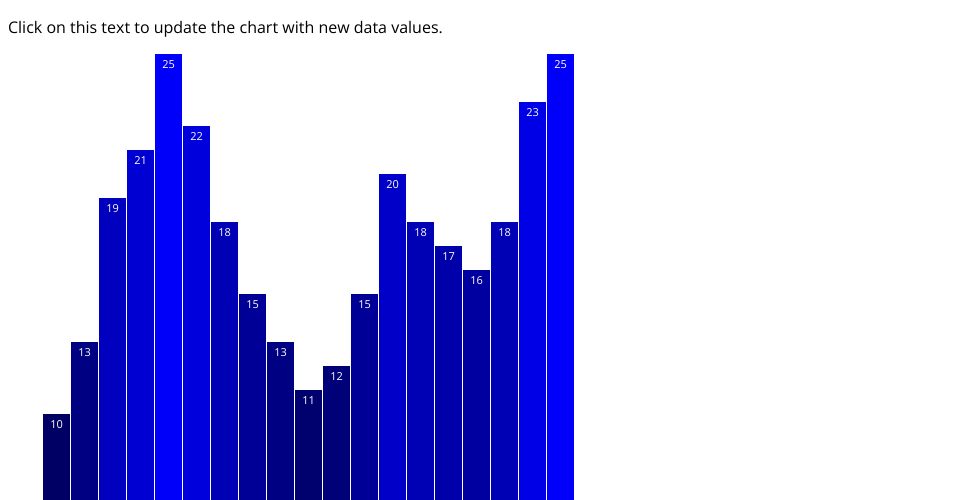
A bar chart that adds data with mouse-click
2
Forks
0
Likes
nikomc
0 views in last 90 days
Last edited Apr 03, 2020
Created on Apr 01, 2020
Forked from
D3: Scaled scatterplot, using a square root scale for circle areas
uses
v1 runtime
Learning about scales with D3 (from Scott Murray's book).
MIT Licensed