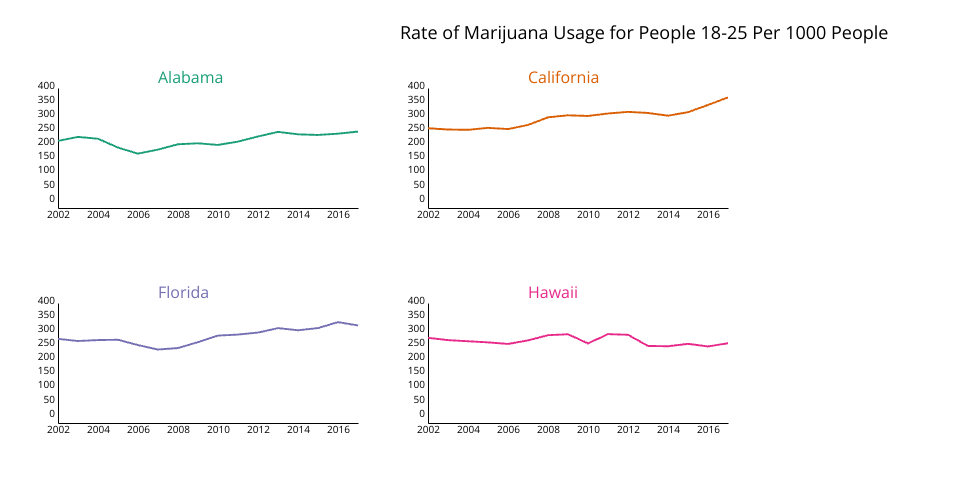
Visualization of marijuana usage rates of people 18-25 (per 1000 people) by state from the CORGIS dataset made with D3. Color legend and threshold code from Susie Lu. Implementation from D3 Graph Gallery. ChatGPT used for title/legend formatting.
Fullscreen to see legend.
MIT Licensed