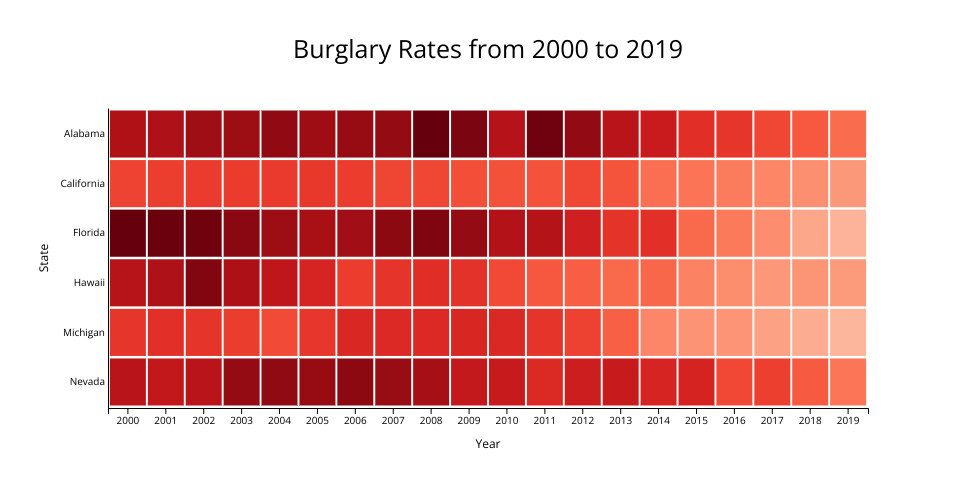
Visualization of burglary rates (per 100k people) by state from the CORGIS dataset made with D3. Color legend and threshold code from Susie Lu. Implementation from D3 Graph Gallery.
Hover over squares to see precise values. Fullscreen to see legend.
MIT Licensed