A scatter plot with D3. 2017 style.
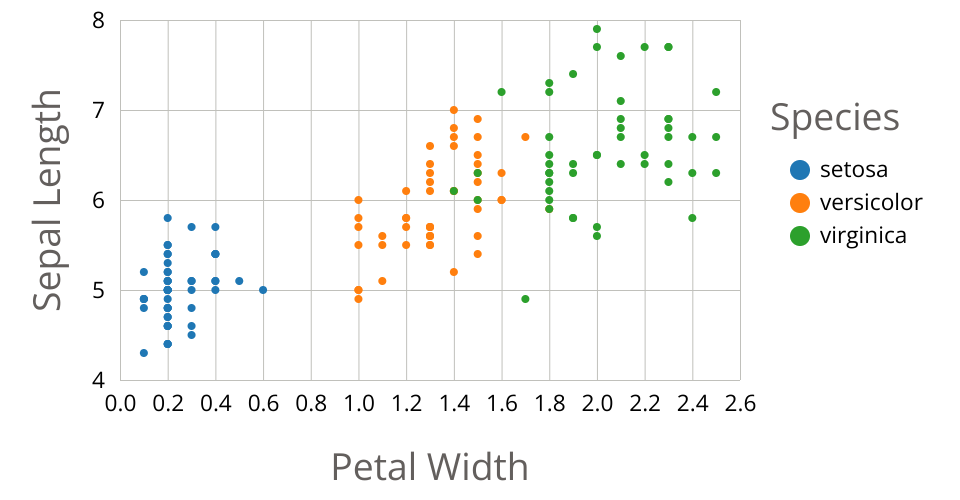
This visualization shows The Iris Dataset. It's designed to emphasize clustering by Petal Length and Sepal Length by Species.
Each circle represents an iris flower.
Ported from Bl.ocks.org: Stylized Scatter Plot with Color Legend.
MIT Licensed