The College Basketball Team Performance Dataset provides a detailed breakdown of team performance during the 2023 college basketball season. It includes advanced metrics that evaluate offensive and defensive efficiency, shooting percentages, rebounding statistics, and other key indicators of team success.
Dataset Breakdown:
- TEAM: The name of the team.
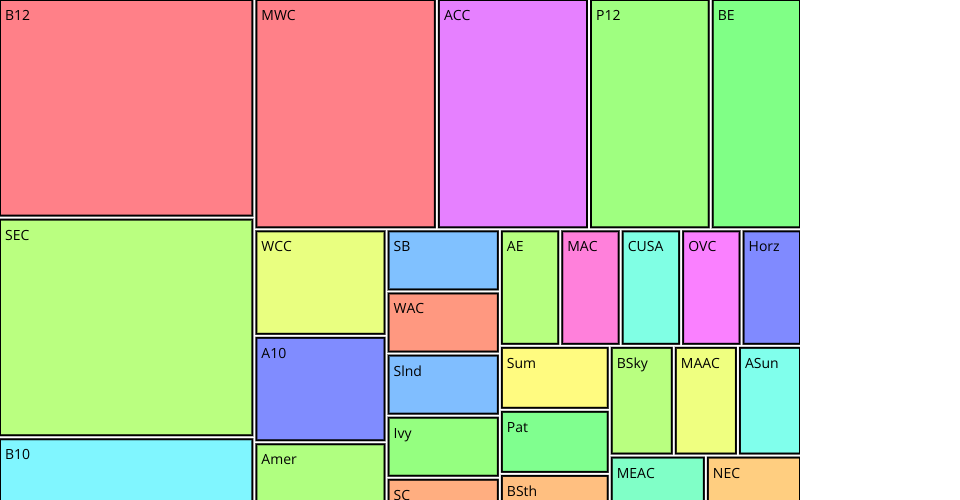
- CONF: The conference the team belongs to.
- G: Number of games played.
- W: Number of games won.
- ADJOE: Adjusted Offensive Efficiency (points per 100 possessions).
- ADJDE: Adjusted Defensive Efficiency (points allowed per 100 possessions).
- EFG%: Effective Field Goal Percentage (adjusted for 3-point shots).
- 3P%: Three-point shooting percentage.
- 2P%: Two-point shooting percentage.
- ORB: Offensive Rebound Percentage.
- DRB: Defensive Rebound Percentage.
- FTR: Free Throw Rate (free throws made per field goal attempt).
- WAB: Wins Above Bubble (a measure of performance relative to tournament qualification).
- SEED: The team's tournament seed.
Tasks for Visualizations:
Compare Seeds by Conference
Purpose: Explore the distribution of tournament seeds across conferences to see which conferences have stronger representation.
Visualization: A box plot comparing SEED across conferences (CONF) to show the spread of team seeds within each conference.Win-Loss Comparison by Conference
Purpose: Compare the win-loss records of teams based on their conference to determine which conferences perform better.
Visualization: A bar chart with conferences on the x-axis and the average win percentage on the y-axis.Distribution of Three-Point Shooting Percentages (3P%)
Purpose: Visualize the distribution of 3-point shooting percentages across all teams.
Visualization: A histogram displaying the frequency of different 3-point shooting percentages.Relationship Between Effective Field Goal Percentage (EFG%) and Team Success (WAB)
Purpose: Analyze how effective field goal percentage correlates with team success, measured by Wins Above Bubble (WAB).
Visualization: A scatter plot with EFG% on one axis and WAB on the other, using point size to represent the number of games won (W).Compare Adjusted Offensive and Defensive Efficiency (ADJOE vs ADJDE)
Purpose: Visually explore the relationship between a team’s offensive and defensive efficiency.
Visualization: A scatter plot with ADJOE on the x-axis and ADJDE on the y-axis, using color to represent the team’s conference (CONF) and size to represent the number of games won (W).
Link to the original source:https://www.kaggle.com/datasets/andrewsundberg/college-basketball-dataset