Spotify 2023 Dataset (spotify-2023.csv)
Dataset Overview: The Spotify 2023 Dataset contains data on popular songs from 2023, focusing on key attributes such as popularity, danceability, energy, and acoustic features. This dataset is ideal for exploring trends in the music industry, identifying characteristics that contribute to a song’s popularity, and understanding the diversity of genres and artists on the platform.
Dataset Breakdown:
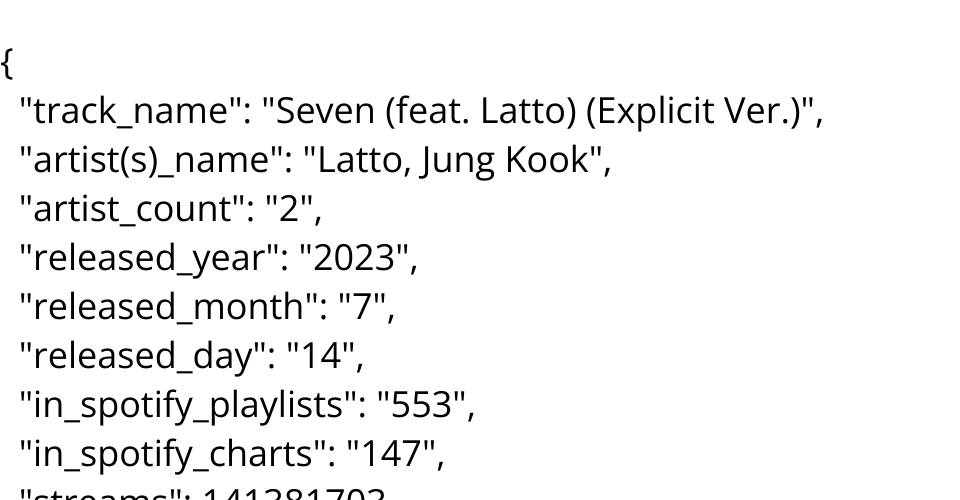
- Track Name: The name of the song.
- Artist(s) Name: The artist(s) who performed the song.
- Released Year: The year the song was released.
- Streams: The total number of streams on Spotify.
- BPM: Beats per minute (tempo of the song).
- Danceability (%): A measure of how suitable a track is for dancing (0-100%).
- Valence (%): Positivity of the track (0-100%).
- Energy (%): The energy level of the track (0-100%).
- Acousticness (%): Acoustic quality of the track (0-100%).
- Instrumentalness (%): Likelihood the track is instrumental (0-100%).
- Liveness (%): Probability that the track was performed live (0-100%).
- Speechiness (%): Measures the presence of spoken words (0-100%).
Tasks for Visualizations:
Compare Streams by Artist
Purpose: Understand which artists have the most popular tracks in terms of streams.
Visualization: A bar chart with artists on the x-axis and their total streams on the y-axis, showing which artists dominate in terms of popularity.Correlation Between BPM and Danceability
Purpose: Explore the relationship between the tempo (BPM) and how danceable a song is.
Visualization: A scatter plot with BPM on one axis and danceability on the other, potentially using color to represent different genres.Distribution of Energy Levels Across Songs
Purpose: Analyze the distribution of energy levels to identify common energy ranges in popular music.
Visualization: A histogram showing the distribution of energy levels across all tracks.Correlation Between Streams and Valence (Positivity)
Purpose: Investigate whether more positive songs (higher valence) tend to have more streams.
Visualization: A scatter plot with valence on one axis and streams on the other, using point size to represent song popularity or genre.Compare Streams by Release Month
Purpose: Examine how the release month of a song affects its popularity in terms of streams.
Visualization: A bar chart or line chart showing streams by release month to identify seasonal trends in music popularity.
Link to the original source: https://www.kaggle.com/datasets/nelgiriyewithana/top-spotify-songs-2023