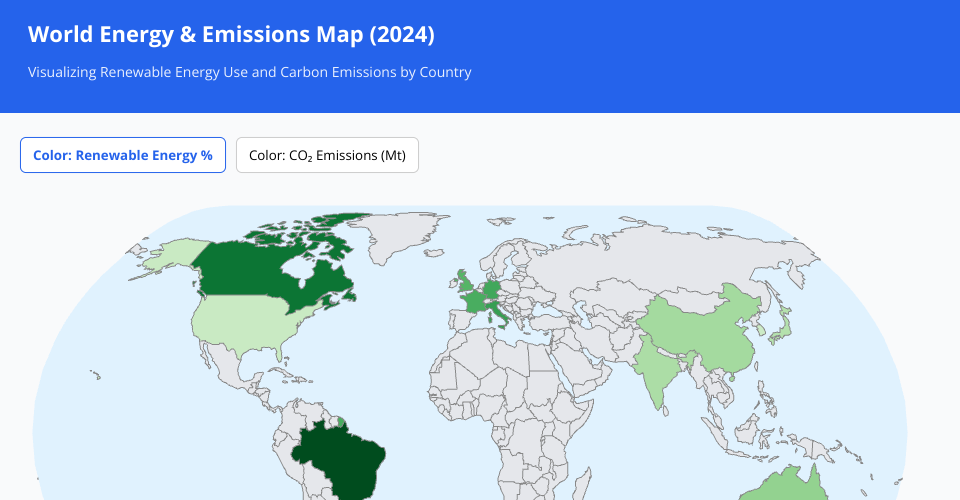
World Energy & Emissions Map (2024)
A D3.js visualization showing renewable energy usage and carbon emissions by country.
Features
- Interactive world map with country-level data
- Toggle between two metrics: Renewable Energy % and CO₂ Emissions
- Hover tooltips showing detailed country information
- Smooth color transitions when switching metrics
Usage
Open index.html in a web browser to view the map.
Data
The visualization includes data for 12 major countries:
- USA, China, India, Germany, Brazil, Canada, Australia, France, Japan, UK, South Korea, Italy
Technologies
- D3.js v7 for visualization
- TopoJSON for geographic data
- Vanilla JavaScript (ES6 modules)
MIT Licensed