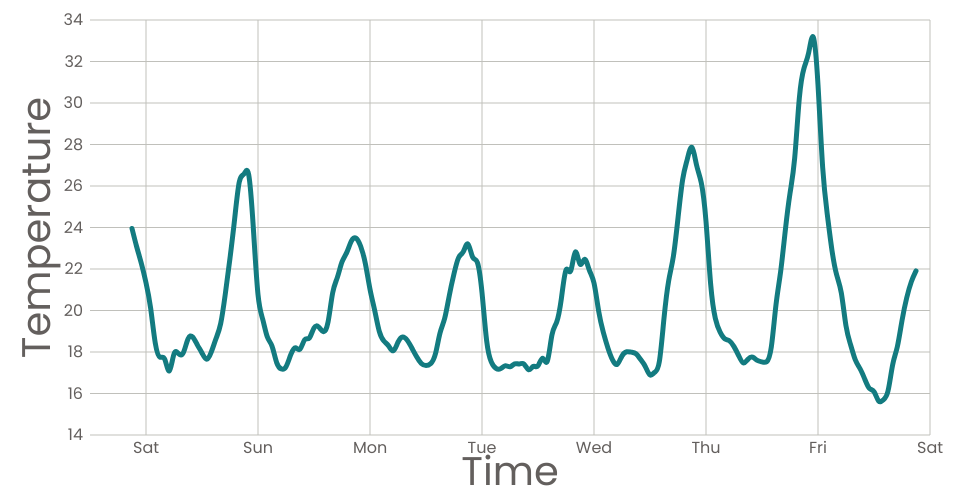
A program that loads in some temperature Data Canvas Sense Your City Dataset using D3 utilities, and uses React to render a line chart.
MIT Licensed
A program that loads in some temperature Data Canvas Sense Your City Dataset using D3 utilities, and uses React to render a line chart.