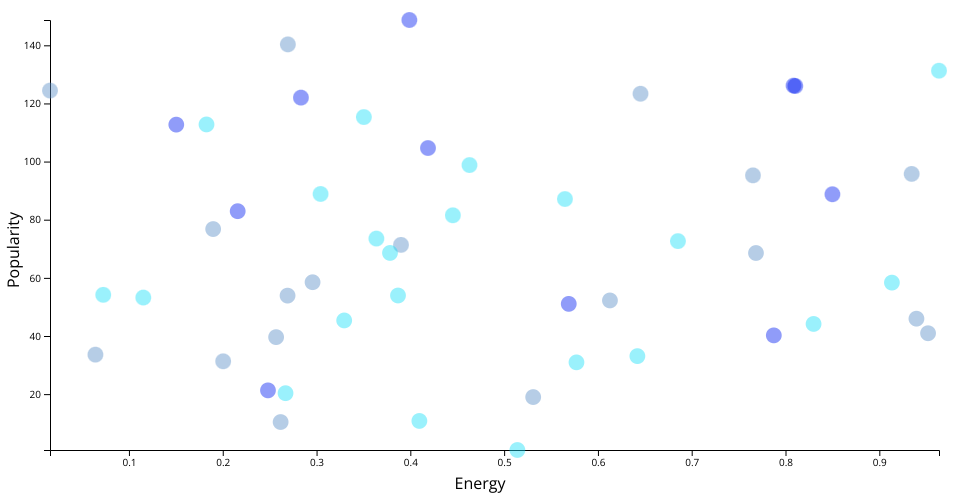
The following pseudo-visualization uses mock data generated by using Math.random().
The vertical position corresponds to the song's quantified 'popularity' and the horizontal position corresponds to its 'energy' level.
The color of the point pertains to the song's valence -- the darkest shade is the lowest valence and the lightest shade is the highest valence.
MIT Licensed