0 views in last 90 days
Minwoo Pak
@minwoopak
Data - Science - Viz
Public vizzes

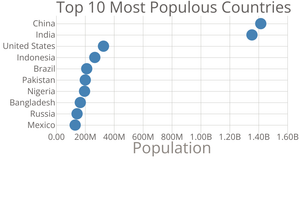
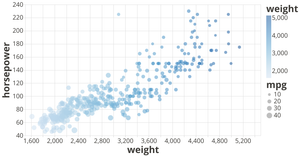
Dataviz 2020_Ep25 - 19. Scatter Plot

Mouse Follower
Jinsu Bubble

Jinsu - Bubblechart

Jinsu - Request

cell_svg_modification
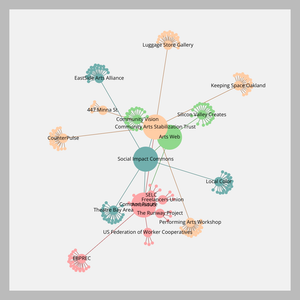
Organization Network Graph
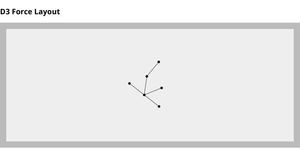
Force Layout
Chorpleth Map

D3 + React + useData
Dataviz 2020_Ep55 - 47. VoronoiOverlay with Labels

Dataviz 2020_Ep56 - 48.Force Directed Graph Starter
VoronoiOverlay retry
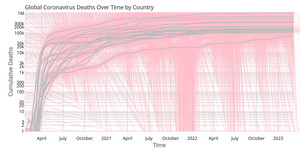
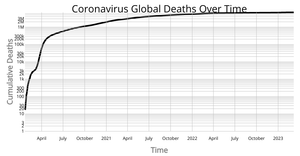
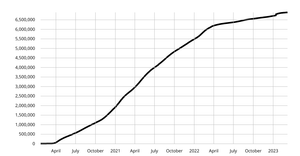
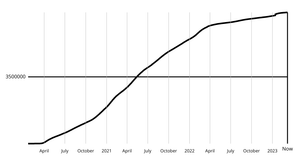
Dataviz 2020_Ep53 - 45. Coronavirus Deaths Over Time by Country
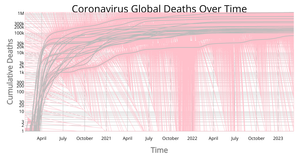
Dataviz 2020_Ep52 - 44. Coronavirus Line Chart - Log Y Axis
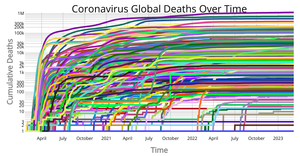
Dataviz 2020_Ep52 - 43. Coronavirus Line Chart - Linear Y Axis
Dataviz 2020_Ep51 - 42. Coronavirus Line Chart - React and D3 Axes

Dataviz 2020_Ep50 - 41. Corona virus Line Chart

Dataviz 2020_Ep49 - 40. Corona virus Line Chart - Preliminary

Dataviz 2020_Ep49 - 39. Coronavirus Load and Present Total Deaths
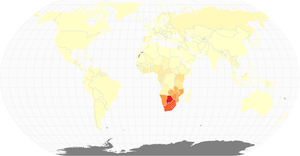
Dataviz 2020_Ep48 - 38. Choropleth Map - (React, D3 - HIV/AIDS data)

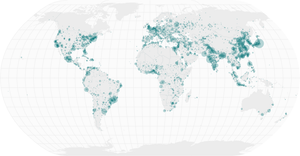
Dataviz 2020_Ep40 - 32. Missing Migrants3 - Sized Circles on a Map

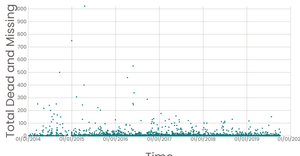
Dataviz 2020_Ep47 - 37. Missing Migrants7 - Log Scale Scatter Plot (Check for Power Law)
Dataviz 2020_Ep45 - 36. Missing Migrants6 - Performance Optimized Brushing (Multiple Views)

Nested Data Join for Each Parent Element but with Different Data

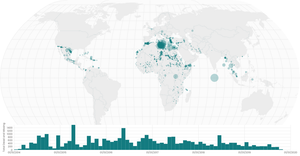
Dataviz 2020_Ep41,43 - 33,34. Missing Migrants4 - Multiple Views
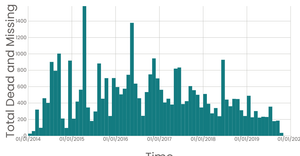
Dataviz 2020_Ep39 - 31. Missing Migrants2 - Binning, Aggregating
Dataviz 2020_Ep38 - 30. Missing Migrants1 - Loading and Visualizing Data
Dataviz 2020_Ep37 - 29. Using Size
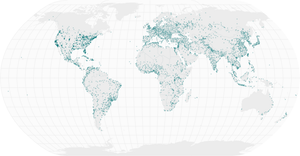
Dataviz 2020_Ep36 - 28. Points on a Map

Dataviz 2020_Ep35 - 27. Interactive Color Legend

Dataviz 2020_Ep34 - 26. Scatter Plot with Color Legend

Dataviz 2020_Ep33 - 26. Scatter Plot with Colors

Dataviz 2020_Ep32 - 25. Polished Scatter Plot with Menus
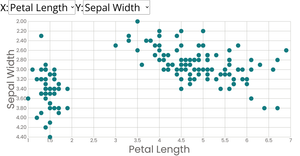
Dataviz 2020_Ep31 - 24. Scatter Plot with Menus

Dataviz 2020_Ep30 - 23. Menus (React)

Dataviz 2020_Ep29 - 22. World Map

Dataviz 2020_Ep27 - 21. Line Chart

Dataviz 2020_Ep26 - 20. Working with Time

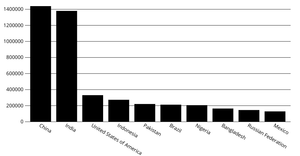
Dataviz 2020_Ep24 - 18. Styling (BarChart Vertical Ver.)

React + D3 + useData Viz Starter

Dataviz 2020_Ep23 - 17. Refactoring (BarChart Vertical Ver.)
Dataviz 2020_Ep22 - 16. Axes (with React and D3) (BarChart Vertical Ver.)

Dataviz 2020_Ep22 - 15. The Margin Convention (with React and D3) (BarChart Vertical Ver.)

Dataviz 2020_Ep15 - 9. Loading and Parsing DSV Data with D3

Dataviz 2020_Ep21 - 14. Bar Chart (with React and D3) (Vertical Ver.)

Customizing Axes

Bar chart with D3.js

Melting Data for Multiple Lines

geneInfoTable

Practice
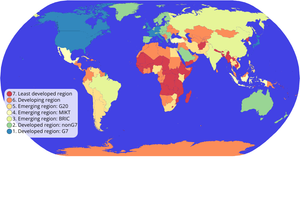
Chorpleth Map with Interactive Filtering

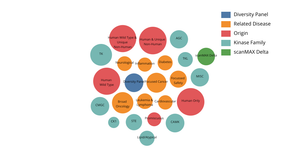
Bowl of Fruit - Interaction(Click to Select)

Scatter Plot with Menus

Visualization Project - Gene Cell Locations

Protein Localization Visualization

Scatter Plot(Continuous Values)

Blank Canvas

Data Table Summary

Bar Chart - Protein Localization
Dataviz 2018 - 3. Bar Chart - D3 CSV Data Import, Data Joins, Scales, Margin Convention, Axes - Ep7

Dataviz 2018 - 2. D3 starter, SVG DOM manipulation, transition(animation), Smile Face - Ep4

Dataviz 2018 - 1. SVG Basic Elements - Ep3

Dataviz 2020_Ep22 - 16. Axes with React and D3

Dataviz 2020_Ep22 - 15. The Margin Convention

Dataviz 2020_Ep20 - 13. Pie Chart (with React and D3)

Dataviz 2020_Ep21 - 14. Bar Chart (with React and D3)

Dataviz 2020_Ep20 - 12. Rendering Data Basics (with React and D3)
Dataviz 2020_Ep18 - 11. Vega Lite API template

Dataviz 2020_Ep16 - 10. Loading Data with React and D3

Dataviz 2020_Ep14 - 8. Interaction With React - useState hook, useCallback - Mouse Follower

Dataviz 2020_Ep13 - 7. Loading Data with Fetch, Promises, Async, Await

Dataviz 2020_Ep10 - 6. Face Part 6 - Compartmentalizing Complexity

Dataviz 2020_Ep9 - 5. Face Part 5 - Modularize with ES6 Modules

Dataviz 2020_Ep8 - 4. Face Part 4 - React Components Basics

Dataviz 2020_Ep7 - 3. Face with React AND D3 (Add a mouth): Arc, Group

Dataviz 2020_Ep6 - 2. Face Part 2 (React Basic Setup)

Dataviz 2020: Ep5 - 1. Smiley Face Part 1 (Half face with only HTML)

Table_Cell Integration Trial_SuperSuperSuperFinalFinalFinal

Cell Diagram for Integration
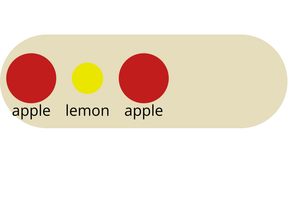
Bowl of Fruit - Nested Elements_Singular Elements

Color and Size Legends
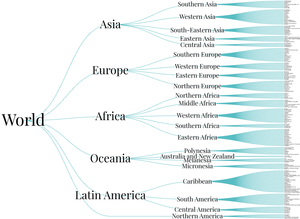
World Countries Tree

Preliminary Tree

Bowl of Fruit - Interaction(Hover to Select)

Cheap Tricks for Interaction - Hover, Tooltip, Zoomin

Making a World Map

Bowl of Fruit -Animation- Eat Another Apple

Bowl of Fruit - Export Module to separate file

Bowl of Fruit - General Update Pattern

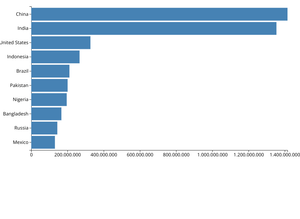
World Population Area Chart

Temperature in San Francisco Area Chart

Temperature in San Francisco Line Chart

Temperature in San Francisco Scatter Plot