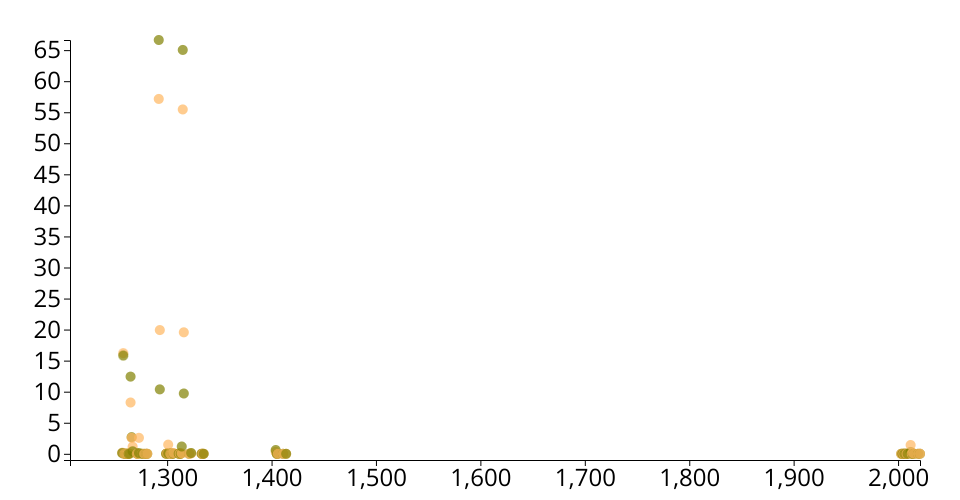
A scatter plot of foundation food nutrition data.
This scatter plot shows the nutrient level in two types of oil.
This data is about nutrition in foundation food that recently acquired (by 2020).
Foods whose nutrient and food component values are derived primarily by chemical analysis.
Original data is from US Department of Agriculture, published in April 2021. I have filtered data on foundation food only and acquiring date by 2020
X axis is nutrient id. Here are some id and corresponding name.
| Nutrient id | Nutrient name |
|---|---|
| 1292 | Fatty acids, total monounsaturated |
| 1315 | MUFA 18:1 c |
| 2006 | SFA 21:0 |
Y axis is the amount (in g) of the nutrient per 100g of food.
Colors of dots indicate two types of oil, peanut oil and extra light olive oil.
We can see that the extra light olive oil has significantly more monounsaturated fatty acids than peanut oil. They have similar amounts of saturated fatty acids (SFA) 21:0.
*This is a part of week 3 assignmnet: Visualize your Data