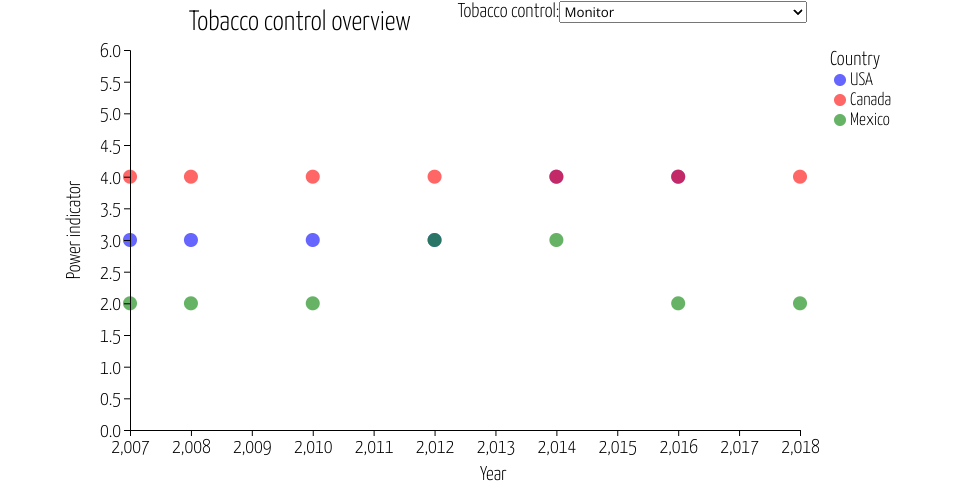
A scatter plot of tobacco control data with menu.
This scatter plot is to show that tobacoo control overview for three countries reported by MPOWER from 2007 to 2018.
Three countries: Canada, United States of America and Mexico.
Original data resource is WHO Global Health Observatory data repository, and I have uploaded it to a gist link on Github.
X axis is year, from 2007 to 2018.
Y axis is power indicator of tobacco control that you choose. A higher number means a more powerful control on tobacco.
You can choose what type of tobacco control you want to check through the menu bar on the top of the plot.
*This is a part of week 6 assignmnet: Add Interaction
MIT Licensed