Washington State Electric Vehicles Dashboard
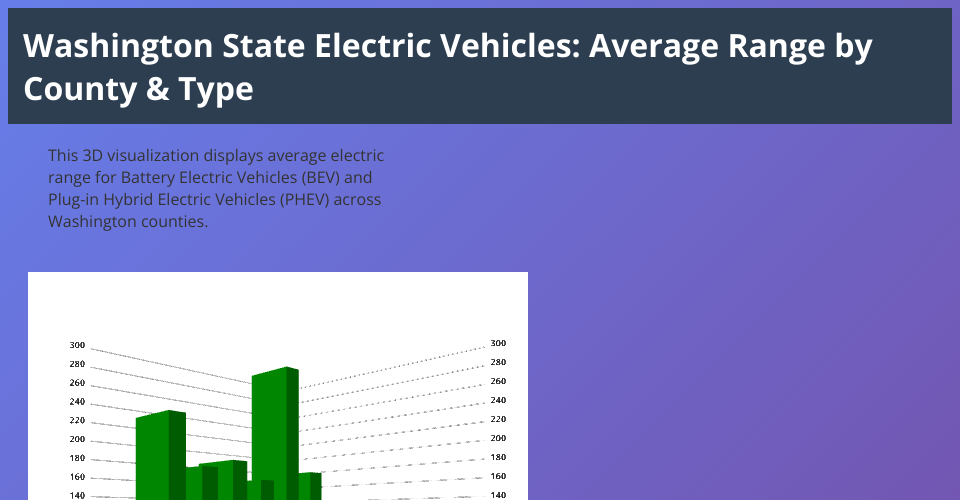
An interactive data visualization dashboard showing electric vehicle adoption trends and characteristics across Washington State counties using D3.js.
Features
- Multi-Series Line Chart: Tracks average electric range trends from 2012-2025 for BEV (Battery Electric Vehicle) and PHEV (Plug-in Hybrid Electric Vehicle) separately
- Combined Bar + Line Chart: Displays vehicle distribution (bars) by county alongside average electric range (line)
- Interactive Elements: Hover tooltips on data points for detailed information
- Custom Color Scheme: Distinguishes between vehicle types and chart elements
- Gridlines: Horizontal gridlines for easier data reading
- Responsive Legend: Clear legend identifying each data series
- Customizations:
- Gradient background
- Hover effects on interactive elements
- Distinct color palette for accessibility
- Horizontal gridlines for reference
- Data point tooltips on hover
Data Source
The dashboard reads from Assignment6.csv containing
Washington State electric vehicle registration data with:
- County: Washington State county name
- Model Year: Vehicle model year (2012-2025)
- Electric Vehicle Type: BEV or PHEV classification
- Electric Range: Range in miles
- Additional fields: Make, Model, City, State, etc.
Data Processing
Line Chart Data:
- Groups vehicles by Model Year and EV Type
- Calculates average electric range for each year and type
- Shows temporal trends in vehicle technology
Combined Chart Data:
- Groups vehicles by County
- Counts total vehicles per county
- Calculates average electric range per county
- Sorts by vehicle count for easier comparison
Key Insights
- BEV vehicles show increasing electric range over time (84-322 miles)
- PHEV vehicles have shorter electric-only ranges (13-97 miles)
- King County has the highest EV adoption in Washington State
- Technology Trend: Newer vehicle models (2018+) have significantly higher average ranges
Requirements
- Modern web browser with JavaScript enabled
- CSV file (
Assignment6.csv) in the same directory asindex.html - Internet connection (loads D3.js from CDN)
Usage
- Place
Assignment6.csvin the same directory asindex.html - Open
index.htmlin a web browser - Hover over data points to see detailed information
- Charts are fully responsive
Libraries Used
- D3.js v5 - Data-driven visualization
Chart Customizations
Line Chart:
- ✅ Legend distinguishing BEV and PHEV
- ✅ Labeled X-axis (Model Year) and Y-axis (Average Electric Range)
- ✅ Horizontal gridlines for reference
- ✅ Interactive dots with hover tooltips
- ✅ Color scheme: Green for BEV, Red for PHEV
- ✅ Clear title and description
Combined Chart:
- ✅ Legend for both bars and line
- ✅ Dual Y-axes (left for count, right for range)
- ✅ Labeled X-axis (County names rotated for readability)
- ✅ Horizontal gridlines
- ✅ Interactive bars and line dots with tooltips
- ✅ Color scheme: Blue for vehicle count, Orange for average range
- ✅ Clear title and description
File Structure
MIT Licensed