
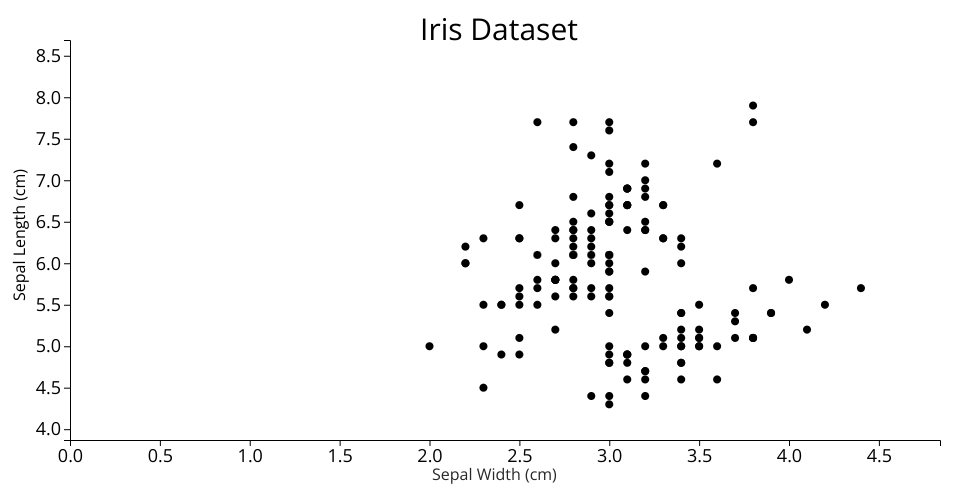
A reusable D3 scatterplot built following the convention layed out in Mike Bostock's Towards Reusable Charts
Allows specification of a number of values including the size of the points, the accessor functions for x and y values, the symbols to be used for points, the chart title, and axes labels. When any of the options are not set (except for the data value) default values are supplied.
Axis ranges by default extend 10% above and below the smallest and largest data points. This prevents points from running into the axes which I think looks bad. There is currently no defined method to alter this behavior.
MIT Licensed