
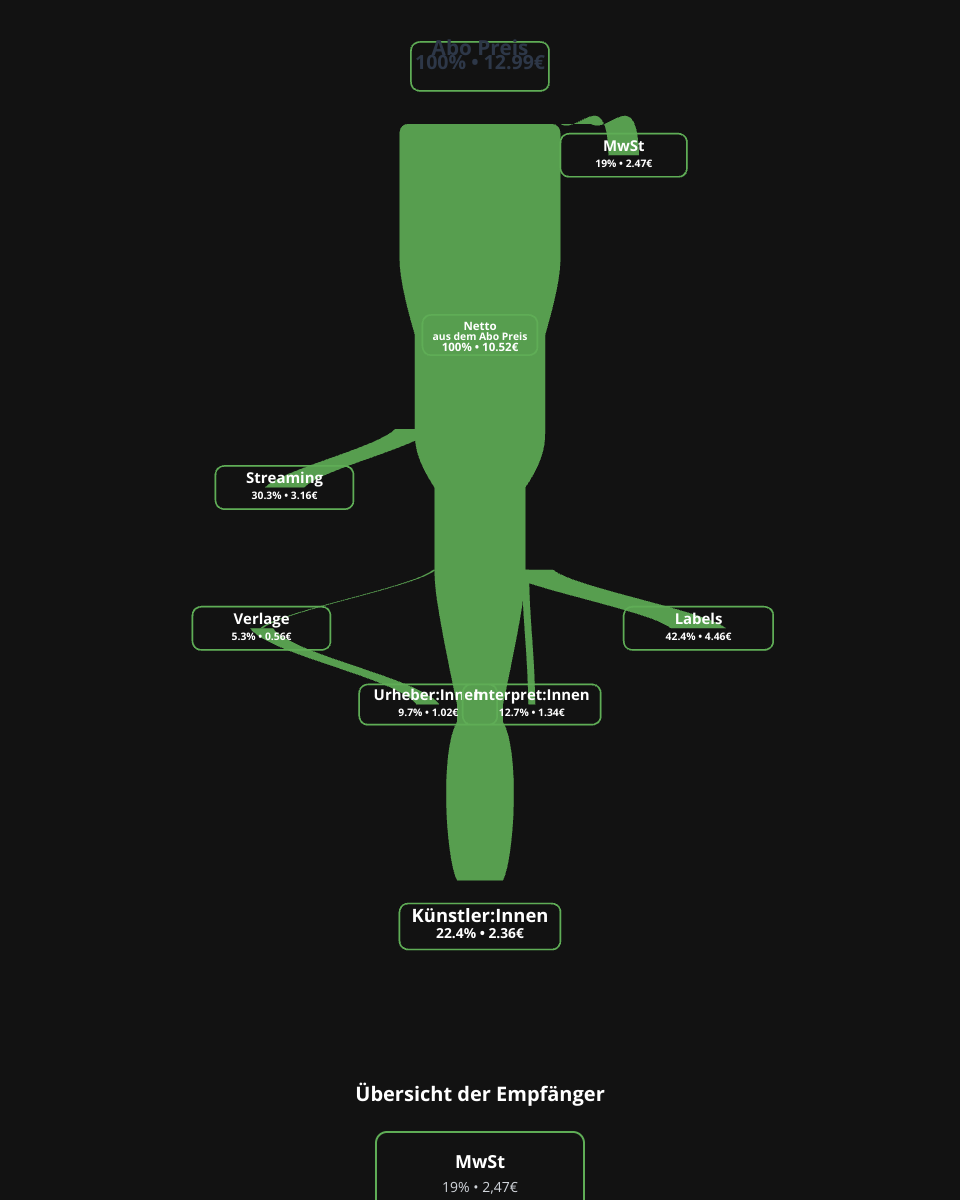
Sankey Diagram - Music Streaming Revenue Distribution
A React-based interactive Sankey diagram showing how music streaming subscription revenue is distributed among artists, labels, platforms, and other stakeholders.
Features
- 📊 Data-driven flow visualization
- 🎨 Beautiful gradient paths with branching flows
- 📱 Responsive SVG rendering
- ⚙️ Modular, reusable architecture
- 🎯 Support for hierarchical flow distributions
Project Structure
MIT Licensed