Music Streaming Analytics Dashboard
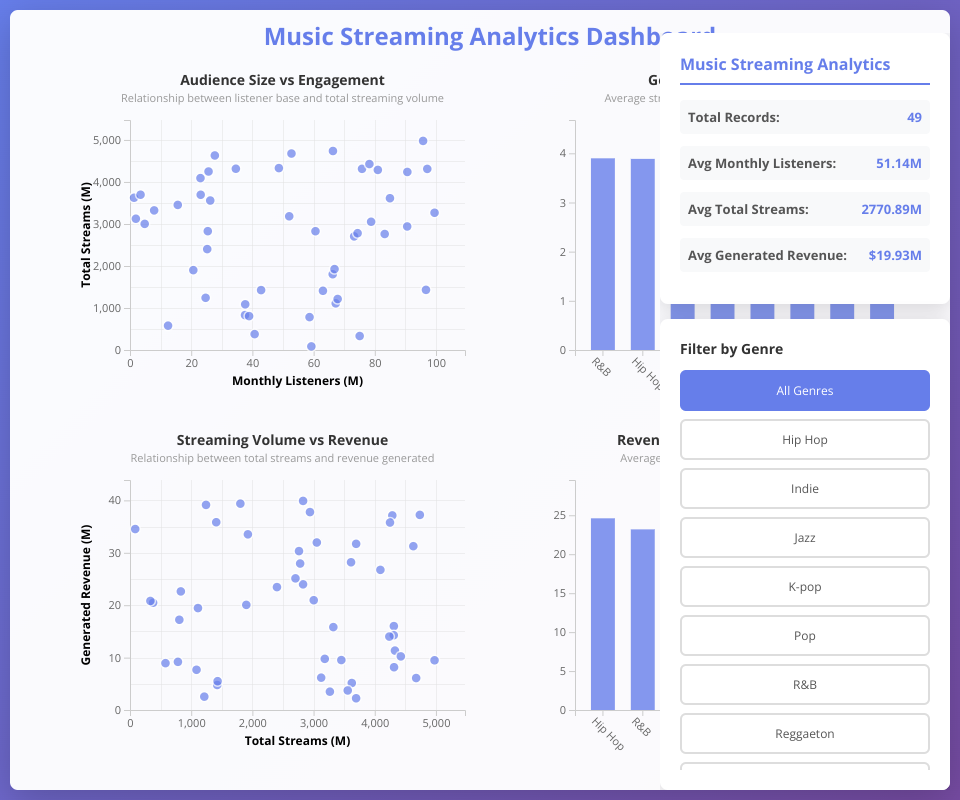
Interactive data visualization dashboard built with React and D3.js that analyzes music streaming patterns across genres, platforms, and audiences.
Features
4 Linked Visualizations:
- Audience Size vs Engagement - Scatter plot showing relationship between listener base and total streaming volume
- Genre Listening Habits - Bar chart comparing average stream duration by genre (click to filter)
- Streaming Volume vs Revenue - Scatter plot showing how total streams correlate with generated revenue
- Revenue Performance by Genre - Bar chart showing average generated revenue by genre type
Interactive hover effects on all charts
Genre filtering with real-time dashboard updates
Responsive grid layout
Axis labels and grid lines for easy reading
Animated transitions
How to Use
- Filter by Genre - Click any bar in the "Genre Listening Habits" chart to filter all data and statistics
- View Details - Hover over data points to highlight them
- Understand Trends - Each chart title explains what relationship is being visualized
- Monitor Stats - Right panel shows real-time statistics for selected genre or all data
Data Metrics
- Monthly Listeners (Millions)
- Total Streams (Millions)
- Total Hours Streamed (Millions)
- Average Stream Duration (Minutes)
- Streams Last 30 Days (Millions)
- Platform Type (Free/Premium)
- Generated Revenue (Millions)
MIT Licensed