A program that loads and parses some CSV data from the Fatal Police Shootings Database compiled by the Washington Post
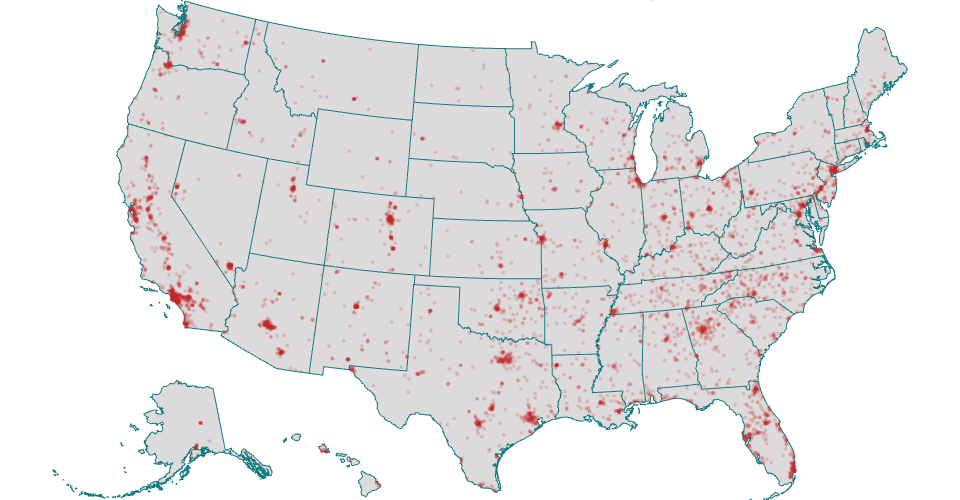
I used the U.S. Geo Map of State Boundaries for the underlying map. In this iteration, I used the geoAlbersUsa projection to clean up and zoom in on the map. While other projection types appear to gracefully handle a lat/long input of 0, it returns null with this projection, which causes a fatal error when you reference the scaled pixel locations.
Adapted from Mass School District Boundaries from the DataVis class.
The intent is to map each event to it's location within the U.S. with a semitransparent circle to show darker regions as the areas with higher event density. There are clearly areas with more events, though at a glance they appear to be in population centers.
To do:
- <input checked="" disabled="" type="checkbox"> Improve zoom level for better visibility
- <input disabled="" type="checkbox"> aggregate data per state
- <input disabled="" type="checkbox"> develop a module to build a pie chart
- <input disabled="" type="checkbox"> develop a module to plot pie charts in the center of each state
- <input disabled="" type="checkbox"> use the path.centroid() function to plot aggregated data