A program that loads and parses some CSV data from the Fatal Police Shootings Database compiled by the Washington Post
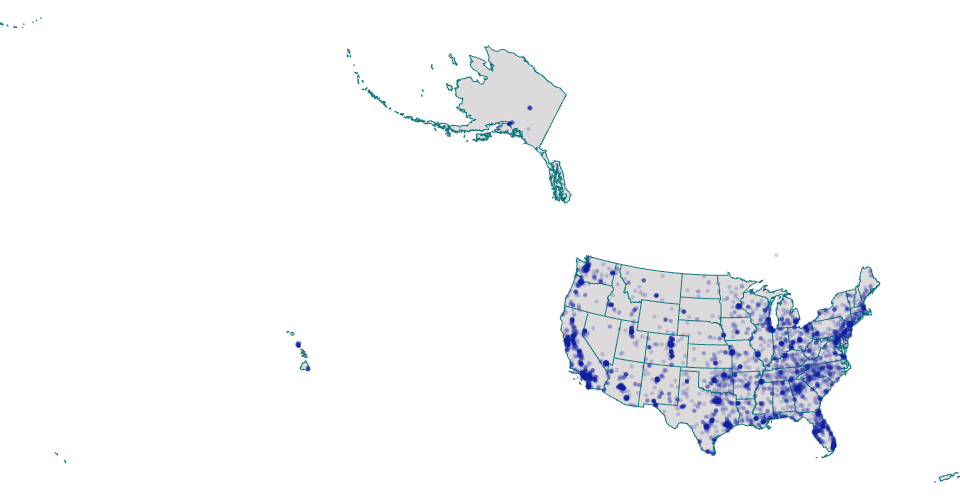
I used the U.S. Geo Map of State Boundaries for the underlying map. I'm not quite sure how to improve the zoom, other than to cut out the areas in the corners of the map to refocus the extent() function.
Adapted from Mass School District Boundaries from the DataVis class.
The intent is to map each event to it's location within the U.S. with a semitransparent circle to show darker regions as the areas with higher event density. There are clearly areas with more events, though at a glance they appear to be in population centers.
To do:
- Improve zoom level for better visibility
- aggregate data per state
- develop a module to build a pie chart
- develop a module to plot pie charts in the center of each state
- use the path.centroid() function to plot aggregated data
MIT Licensed