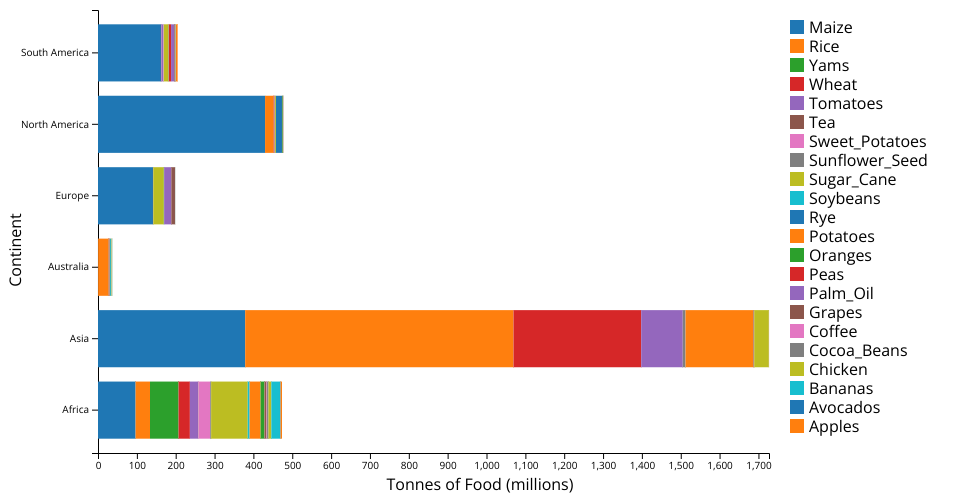
Stacked bars showing estimated food production breakdown of the continents. Based on an example from the tutorial
https://www.kaggle.com/datasets/rafsunahmad/world-food-production
https://raw.githubusercontent.com/lukesavoie/dataviz/main/world%20food%20production.csv loaded and parsed as CSV.
MIT Licensed