Resources
Contact
Pricing
🇺🇸
EN
Log in
Open Editor
Revision History
Export Image
Share
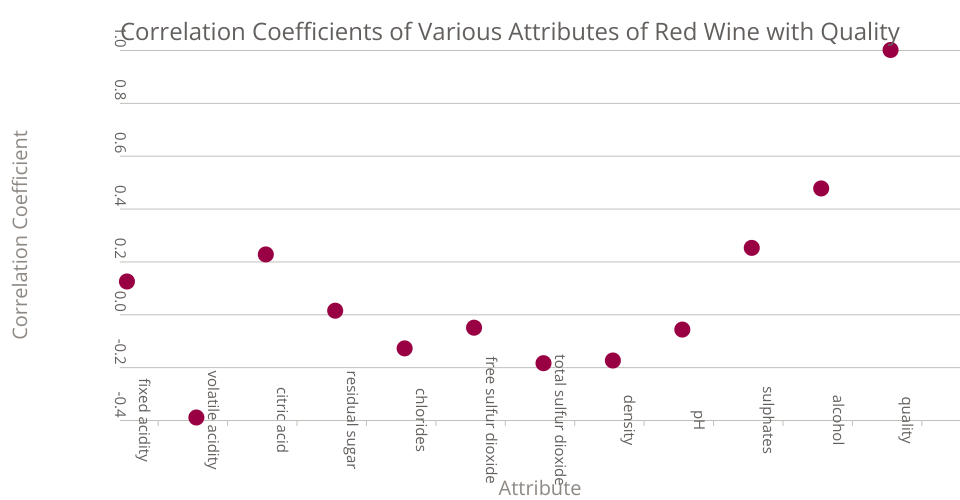
Wine: Correlation Coefficient Scatter
0
Forks
0
Likes
Louisa Penrice
0 views in last 90 days
Last edited Apr 30, 2024
Created on Apr 29, 2024
Forked from
Cars Scatter Plot
uses
v2 runtime
This scatter plot shows data about cars, from
UCI Machine Learning Repository: Auto MPG Data Set
.
MIT Licensed