An example including some commonly used features of SVG.
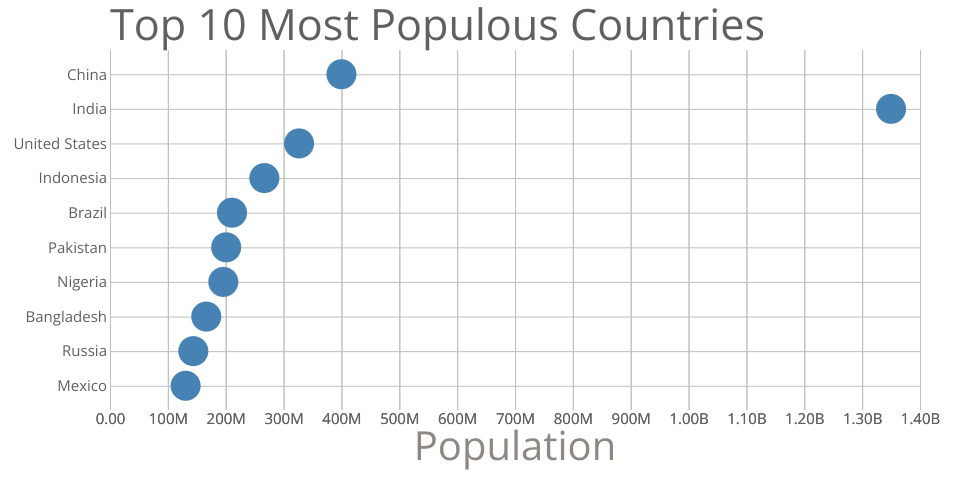
This bar chart shows population of the top 10 most populous countries. The data comes from the year 1018 estimate from the year 2018 eestimate in [World Population Prospects 2017]
MIT Licensed
An example including some commonly used features of SVG.
This bar chart shows population of the top 10 most populous countries. The data comes from the year 1018 estimate from the year 2018 eestimate in [World Population Prospects 2017]