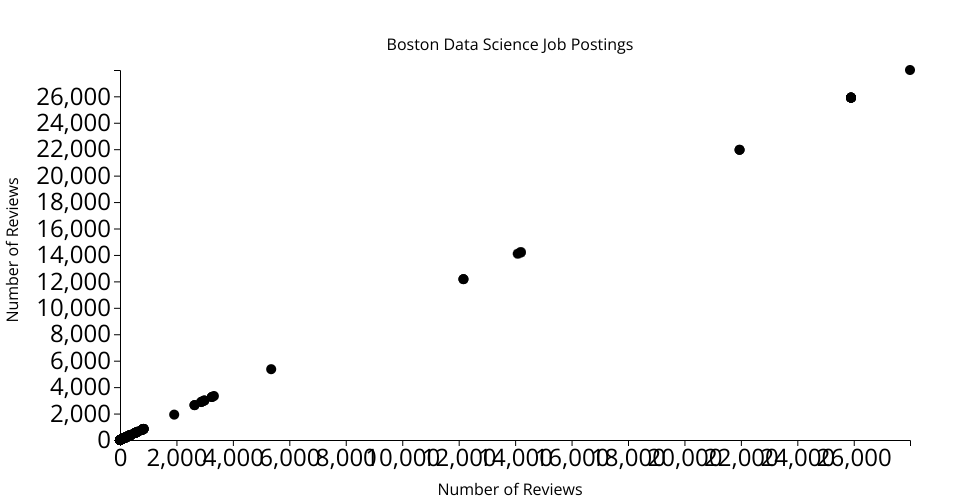
A vanilla HTML implementation of a D3 scatter plot. Shows the "Data Scientist Job Market in the U.S." data set's number of reviews per job posting for Boston jobs only, which is the only continuous value from the set. This data is loaded from my gist, which is sourced from Kaggle.