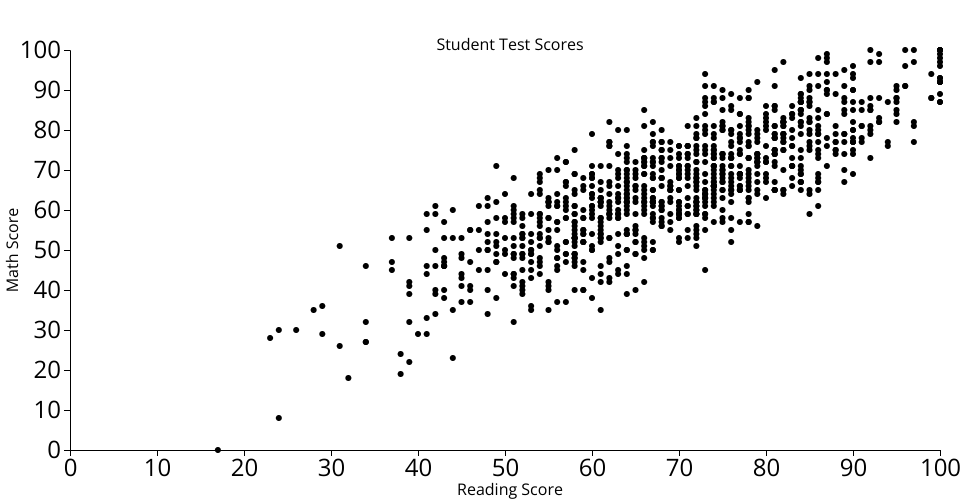
A vanilla HTML implementation of a D3 scatter plot. Shows the relationship between math and reading scores from the "Students Performance in Exams" data set loaded from my gist, which is sourced from Kaggle.