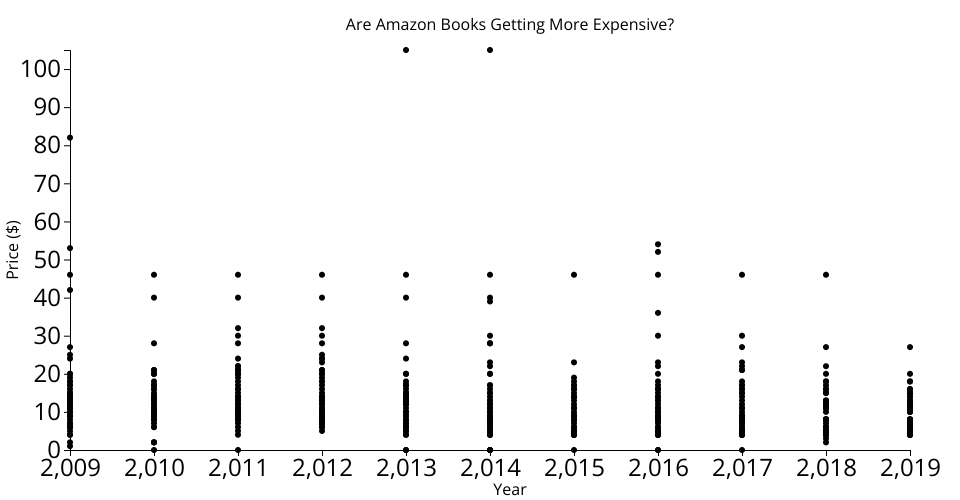
A vanilla HTML implementation of a D3 scatter plot. Shows the "Amazon Top 50 Bestselling Books 2009 - 2019" data sets relationshiph between price and year. This data set was loaded from my gist which was sourced from Kaggle.