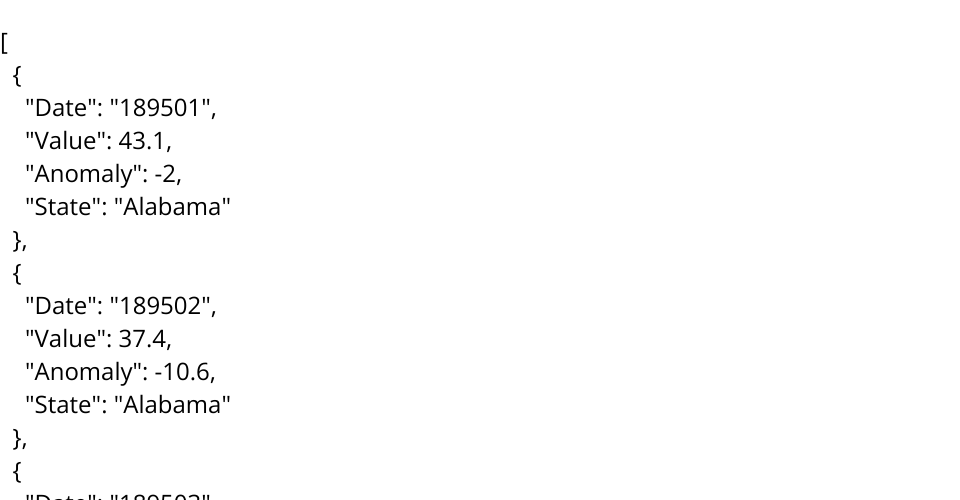
Datasets represents Continuous US Average Temperature from 1895 to December 2022.It consists of columns - Date of type Quantitative, Value of type Quantitative : Temperature in Fahrenheit, Anomaly of type Quantitative Anomalies are the departures from 1901–2000 temperature average and State of type Categorical is the US state where the temperature was observed. This data currently displays data for only one State. Data for multiple State can be accessed from National Centers for Environmental Information - https://www.ncei.noaa.gov/access/monitoring/climate-at-a-glance/statewide/time-series/1/tavg/all/12/1895-2022?base_prd=true&begbaseyear=1901&endbaseyear=2000
Ideas - visualization similar to this can be created - https://public.tableau.com/app/profile/rush1056/viz/Temperatureanomalydifference-Australia/Dashboard2