I try to use d3.js a very powerful and simple library for interactive visualization
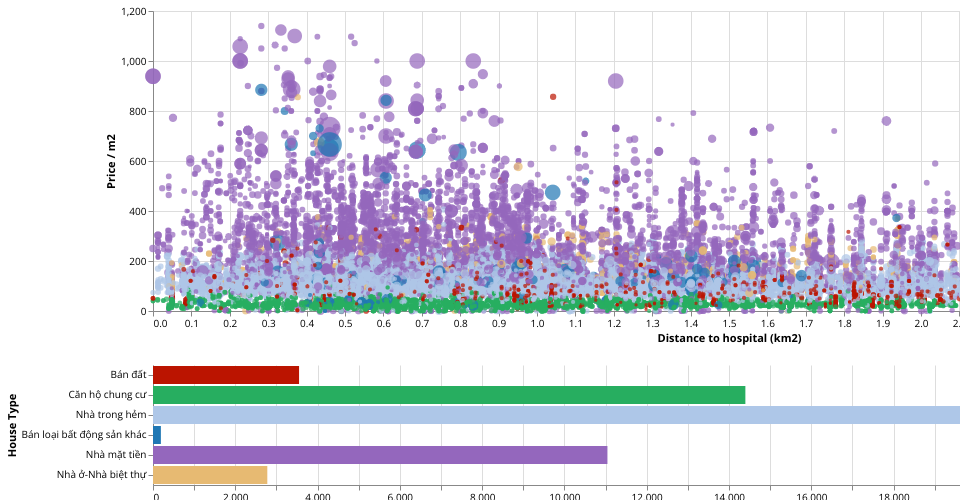
In this viz, above is the scatter plot to show the relationship between area(m2) and price per m2. the below is the barplot of the number of each house type
We can use the interval select in scatter plot to select the interval(price per m2) and can click the mouse to select the type of house to view in the bar plot
MIT Licensed