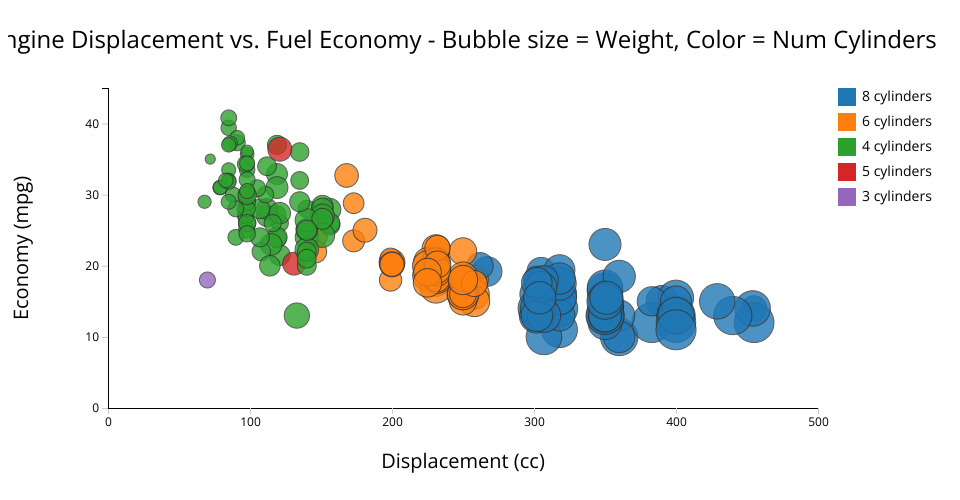
Bubble chart - Engine Displacement vs. Fuel Economy - Bubble size = weigth, Color = Num Cylinders
karldif01
0 views in last 90 days
Last edited Feb 26, 2025
Created on Feb 26, 2025
Forked from Scatterplot: Horsepower and MPG in D3
uses v1 runtime
MIT Licensed