
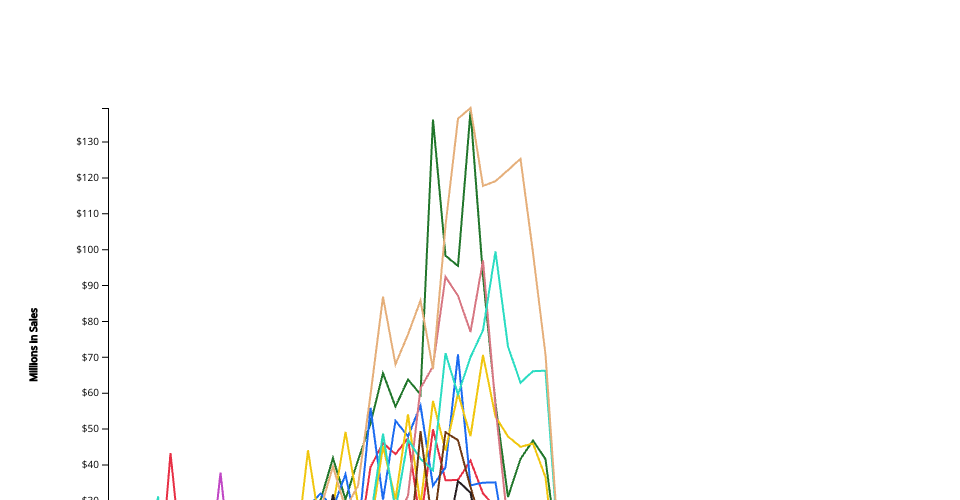
This is a box plot representation of WHole milk fluid sales from 2000 to 2017. Referenced https://www.d3indepth.com/scales/ for quantile of data and as well as Alark Joshis for skeleton of x and y axis
Min:13914800000 Max:18822800000 Median:15630200000 First Quartile: 14572075000 Third Quartile: 17548050000
Link to original data set: https://github.com/rfordatascience/tidytuesday/blob/master/data/2019/2019-01-29/fluid_milk_sales.csv
Link to altered data set: https://gist.github.com/jtchan2/4cbfd1da42fe06ff9ccfe4b9ab680286
MIT Licensed