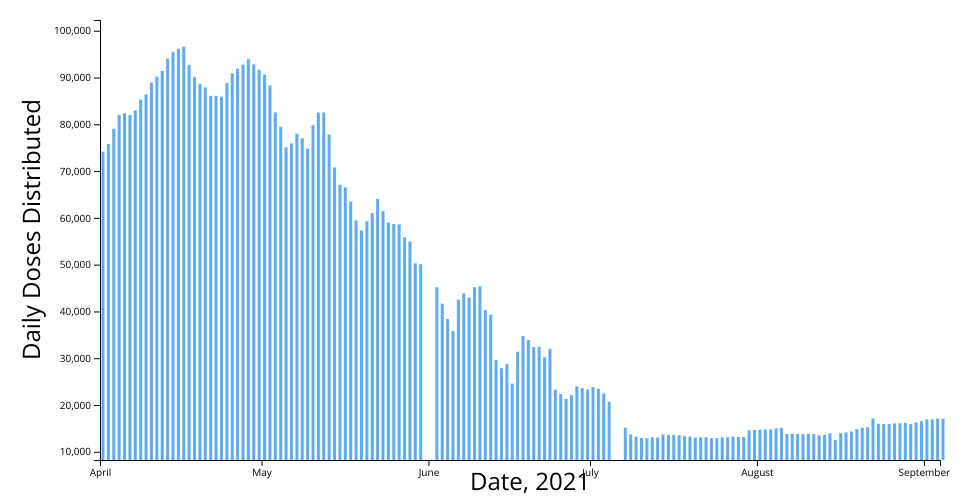
A daily bar chart of COVID-19 Vaccination doeses administered in the state of Massachusetts. The dataset visualized contains daily vaccination information for all US states starting 04/01/2021 and running through 09/04/2021. Relevant attributes include the date, location (state), total number of vaccinations, total vaccinations distribution, the number of people vaccinated, the number of people fully vaccinated, the share of doses used and more. At present the visualization only shows daily doses administered in Massachusetts until more advanced data selection is implemented.
As part of this iteration I have made several changes. First I corrected the generation of my bar heights, in the previous version the bar heights were accidentally created to have a height inversely proportional to the number of doses rather than proportional. I have corrected this by simply flipping the order of the arguments provided to the yScale. Next I added an interaction for hover highlighting such that when the user places their mouse above a bar in the plot the rest of the plot will become less opaque to highlight the selected datapoint. Additionally I added a tooltip which includes the date of that bar and the number of vaccine doses adminstered on that date. Lastly I added axis labels for both the x and y axis.
Data Source: US Vaccination Data by State/Territory